LensCrafters 2004 Annual Report Download - page 67
Download and view the complete annual report
Please find page 67 of the 2004 LensCrafters annual report below. You can navigate through the pages in the report by either clicking on the pages listed below, or by using the keyword search tool below to find specific information within the annual report.-
 1
1 -
2
-
3
-
4
-
5
-
6
-
7
-
8
-
9
-
10
-
11
-
12
-
13
-
14
-
15
-
16
-
17
-
18
-
19
-
20
-
21
-
22
-
23
-
24
-
25
-
26
-
27
-
28
-
29
-
30
-
31
-
32
-
33
-
34
-
35
-
36
-
37
-
38
-
39
-
40
-
41
-
42
-
43
-
44
-
45
-
46
-
47
-
48
-
49
-
50
-
51
-
52
-
53
-
54
-
55
-
56
-
 57
57 -
 58
58 -
 59
59 -
 60
60 -
 61
61 -
 62
62 -
 63
63 -
 64
64 -
 65
65 -
 66
66 -
 67
67 -
 68
68 -
 69
69 -
 70
70 -
 71
71 -
 72
72 -
 73
73 -
 74
74 -
 75
75 -
 76
76 -
 77
77 -
78
-
79
-
80
-
81
-
82
-
83
-
84
-
85
-
86
-
87
-
88
-
89
-
90
-
91
-
92
-
93
-
94
-
95
-
96
-
97
-
98
-
99
-
100
-
101
-
102
-
103
-
104
-
105
-
106
-
107
-
108
-
109
-
110
-
111
-
112
-
113
-
114
-
115
-
116
-
117
-
118
-
119
-
120
-
121
-
122
-
123
-
124
-
125
-
126
-
127
-
128
-
129
-
130
-
131
-
132
-
133
-
134
-
135
-
136
-
137
-
138
-
139
-
140
-
141
-
142
-
143
-
144
-
145
-
146
-
147
-
148
-
149
-
150
-
151
-
152
-
153
 |
 |

66
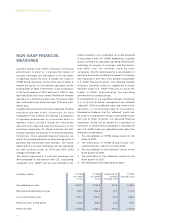
NON-GAAP FINANCIAL
MEASURES
Luxottica Group uses certain measures of financial
performance in order to: i) exclude the impact of
currency exchange rate fluctuations in the translation
of operating results into Euro, ii) include the results of
OPSM Group operations for the entire year of 2003, iii)
include the results of Cole National operations for the
fourth quarter of 2003. Furthermore, iv) the comparison
of the fourth quarter of 2004 and that of 2003 is also
distorted by the fact that Luxottica Retail North America
operates on a 52/53 week fiscal year. Fiscal year 2003
was a 53-weeks year, while fiscal year 2004 was a 52-
weeks year.
Luxottica Group believes that these adjusted financial
measures provide useful information for both
management and investors by allowing a comparison
of operating performance on a consistent basis. In
addition, since Luxottica Group has historically
reported such adjusted financial measures to the
investment community, the Group maintains that their
inclusion provides consistency in its financial reporting.
Furthermore, these adjusted financial measures are
one of the principal indicators used by management in
planning and forecasting future periods. The results
expressed at a constant exchange rate are calculated
for each currency using, for 2004 and 2003, 2003
average exchange rate.
The results expressed at a constant exchange rate
were prepared in accordance with U.S. accounting
standards (U.S. GAAP) and are not intended to be
used in isolation or as a substitute for results prepared
in accordance with U.S. GAAP. Additionally, Luxottica
Group’s method of calculating operating performance
excluding the impact of exchange rate fluctuations
may differ from the methods used by other
companies. See the table below for a reconciliation of
operating measures excluding the impact of exchange
rate fluctuations with their most directly comparable
U.S. GAAP financial measures. The adjusted financial
measures should be used as a supplement to results
reported under U.S. GAAP measures to assist the
reader in better understanding the operating
performance of Luxottica Group.
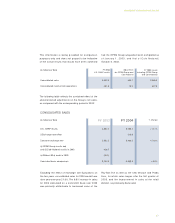
In consideration of the significant changes mentioned
in i), ii), iii) and iv) above, management has included
“adjusted” 2003 consolidated sales and income from
operations in the following table for consistency.
Management believes that the “adjusted” results can
be useful in comparing the Group’s 2004 performance
with that of 2003. However, this adjusted financial
information should not be viewed as a substitute for
measures of performance calculated in accordance
with U.S. GAAP measures. Adjusted results reflect the
following considerations:
1. The consolidation of OPSM Group results for the
whole of 2003.
2. The elimination of OPSM Group results from
Luxottica Group’s sales for the entire 2003.
3. The consolidation of Cole National’s results for the
fourth quarter of 2003.
4. The elimination of Cole National’s results for the
fourth quarter of 2003.
5. The elimination of the 53rd week of 2003.
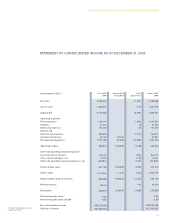
Consolidated net sales
Manufacturing/Wholesale net sales
Less: Intercompany sales
Wholesale sales to third parties
Retail net sales
In millions of Euro
2,852.2
996.7
(172.7)
824.0
2,028.2
FY 2003
U.S. GAAP
results
FY 2004
U.S. GAAP
results
Adjustment for
constant
exchange rates
FY 2004
adjusted results
3,255.3
1,094.8
(186.2)
908.6
2,346.7
213.0
33.1
(14.3)
18.8
194.2
3,468.3
1,127.9
(200.5)
927.4
2,540.9
MANAGEMENT’S DISCUSSION AND ANALYSIS