LensCrafters 2004 Annual Report Download - page 133
Download and view the complete annual report
Please find page 133 of the 2004 LensCrafters annual report below. You can navigate through the pages in the report by either clicking on the pages listed below, or by using the keyword search tool below to find specific information within the annual report.
NOTES TO CONSOLIDATED FINANCIAL STATEMENTS
132
U.S. Holdings used 8.50% as the expected rate of
return on plan assets for fiscal year 2004. This
assumption was developed using the building
block method. Under this approach, the
assumption was arrived at by applying historical
average total returns by asset class over various
time horizons to the plan’s current and target asset
allocation. The resulting assumption was also
benchmarked against the assumptions used by
other U.S. corporations and the pension trust’s
actual investment performance over ten and 20 year
periods.
PLAN ASSETS
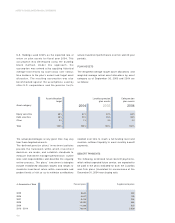
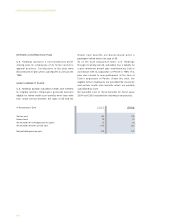
The weighted-average target asset allocations and
weighted average actual asset allocations by asset
category as of September 30, 2003 and 2004 are
as follows:
The actual percentages at any given time may vary
from these targeted amounts.
The defined pension plans’ investment policies
provide the framework within which investment
decisions are made, and establish standards to
measure investment manager performance, outline
roles and responsibilities and describe the ongoing
review process. The plans’ investment strategies
include established allocation targets and ranges to
maximize investment return within reasonable and
prudent levels of risk so as to minimize contributions
needed over time to reach a full funding level and
maintain sufficient liquidity to meet monthly benefit
payments.
BENEFIT PAYMENTS
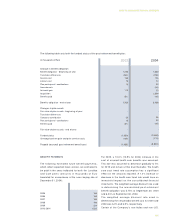
The following estimated future benefit payments,
which reflect expected future service, are expected to
be paid in the years indicated for both the Luxottica
and Cole plans (translated for convenience at the
December 31, 2004 noon buying rate):
Equity securities
Debt securities
Other
Total
Asset category
64%
35%
1%
100%
2004
65%
35%
0%
100%
62%
35%
3%
100%
2003
65%
33%
2%
100%
2004
Luxottica pension
plan assets
Asset allocation
target Cole pension
plan assets
2005
2006
2007
2008
2009
2010 - 2014
In thousands of Euro
8,644
8,647
9,419
10,392
11,366
78,619
Pension plans
263
153
204
864
323
3,339
Supplemental plans


