Kia 2015 Annual Report Download - page 93
Download and view the complete annual report
Please find page 93 of the 2015 Kia annual report below. You can navigate through the pages in the report by either clicking on the pages listed below, or by using the keyword search tool below to find specific information within the annual report.-
 1
1 -
2
-
3
-
4
-
5
-
6
-
7
-
8
-
9
-
10
-
11
-
12
-
13
-
14
-
15
-
16
-
17
-
18
-
19
-
20
-
21
-
22
-
23
-
24
-
25
-
26
-
27
-
28
-
29
-
30
-
31
-
32
-
33
-
34
-
35
-
36
-
37
-
38
-
39
-
40
-
41
-
42
-
43
-
44
-
45
-
46
-
47
-
48
-
49
-
50
-
51
-
52
-
53
-
54
-
55
-
56
-
57
-
58
-
59
-
60
-
61
-
62
-
63
-
64
-
65
-
66
-
67
-
68
-
69
-
70
-
71
-
72
-
73
-
74
-
75
-
76
-
77
-
78
-
79
-
80
-
81
-
82
-
 83
83 -
 84
84 -
 85
85 -
 86
86 -
 87
87 -
 88
88 -
 89
89 -
 90
90 -
 91
91 -
 92
92 -
 93
93 -
 94
94 -
 95
95 -
 96
96 -
 97
97 -
 98
98 -
 99
99 -
 100
100 -
 101
101 -
 102
102 -
 103
103 -
104
-
105
-
106
-
107
-
108
-
109
-
110
-
111
-
112
-
113
-
114
-
115
-
116
-
117
-
118
-
119
-
120
-
121
-
122
-
123
-
124
-
125
-
126
-
127
-
128
 |
 |

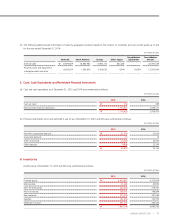
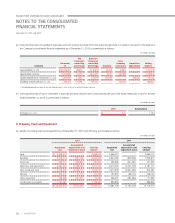
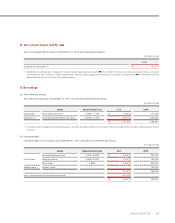
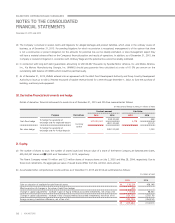
11. Goodwill
(a) Changes in goodwill for the years ended December 31, 2015 and 2014 are summarized as follows:
(In millions of won)
2015 2014
Balance at January 1
₩
37,231 36,290
Other increase(decrease) (196) 941
Balance at December 31
₩
37,035 37,231
(b) Goodwill is allocated to each CGU (Cash Generating Unit) that is expected to benefit from each operating unit. The Company estimated the
recoverable amount of CGU as its value in use calculated by discounting the future cash flows to be generated on the basis of business plan
approved by CEO in five years. Cash flows expected to be generated after five years were estimated within the scope of not to exceed long term
average growth rate of industry. No impairment loss was recognized as a result of the impairment tests in 2015 and 2014.
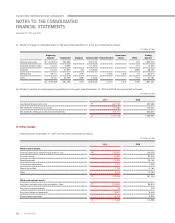
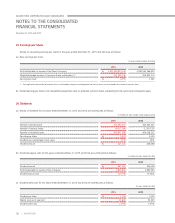
12. Intangible Assets
(a) Details of intangible assets except for goodwill as of December 31, 2015 and 2014 are summarized as follows:
(In millions of won)
2015 2014
Acquisition
cost
Accumulated
amortization and
impairment losses
Carrying
amount
Acquisition
cost
Accumulated
amortization and
impairment losses
Carrying
amount
Development costs
₩
3,536,145 (1,640,337) 1,895,808 2,870,484 (1,220,961) 1,649,523
Industrial property rights 84,614 (71,340) 13,274 76,554 (62,646) 13,908
Software 271,122 (187,553) 83,569 241,723 (155,633) 86,090
Membership (*) 74,449 (11,131) 63,318 72,758 (7,843) 64,915
Other 43,198 (2,417) 40,781 38,525 (1,364) 37,161
₩
4,009,528 (1,912,778) 2,096,750 3,300,044 (1,448,447) 1,851,597
(*) Membership has indefinite useful lives and it has been tested for impairment annually by comparing its recoverable amount to its carrying amount.
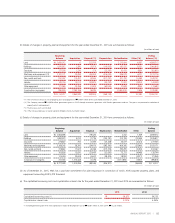
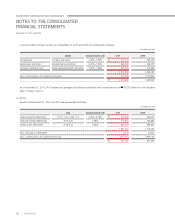
(b) Details of changes in intangible assets for the year ended December 31, 2015 are summarized as follows:
(In millions of won)
Beginning
balance Acquisition Disposal Amortization Reclassification
Impairment
losses Other
Ending
balance
Development costs
₩
1,649,523 663,783 - (418,230) - - 732 1,895,808
Industrial property rights 13,908 4,550 - (2,227) - - (2,957) 13,274
Software 86,090 28,524 (17) (31,545) 418 - 99 83,569
Membership 64,915 2,687 (848) (19) (68) (3,341) (8) 63,318
Other 37,161 5,039 - (1,189) (350) - 120 40,781
₩
1,851,597 704,583 (865) (453,210) - (3,341) (2,014) 2,096,750
87
ANNUAL REPORT 2015 |