Kia 2015 Annual Report Download - page 83
Download and view the complete annual report
Please find page 83 of the 2015 Kia annual report below. You can navigate through the pages in the report by either clicking on the pages listed below, or by using the keyword search tool below to find specific information within the annual report.-
 1
1 -
2
-
3
-
4
-
5
-
6
-
7
-
8
-
9
-
10
-
11
-
12
-
13
-
14
-
15
-
16
-
17
-
18
-
19
-
20
-
21
-
22
-
23
-
24
-
25
-
26
-
27
-
28
-
29
-
30
-
31
-
32
-
33
-
34
-
35
-
36
-
37
-
38
-
39
-
40
-
41
-
42
-
43
-
44
-
45
-
46
-
47
-
48
-
49
-
50
-
51
-
52
-
53
-
54
-
55
-
56
-
57
-
58
-
59
-
60
-
61
-
62
-
63
-
64
-
65
-
66
-
67
-
68
-
69
-
70
-
71
-
72
-
 73
73 -
 74
74 -
 75
75 -
 76
76 -
 77
77 -
 78
78 -
 79
79 -
 80
80 -
 81
81 -
 82
82 -
 83
83 -
 84
84 -
 85
85 -
 86
86 -
 87
87 -
 88
88 -
 89
89 -
 90
90 -
 91
91 -
 92
92 -
 93
93 -
94
-
95
-
96
-
97
-
98
-
99
-
100
-
101
-
102
-
103
-
104
-
105
-
106
-
107
-
108
-
109
-
110
-
111
-
112
-
113
-
114
-
115
-
116
-
117
-
118
-
119
-
120
-
121
-
122
-
123
-
124
-
125
-
126
-
127
-
128
 |
 |
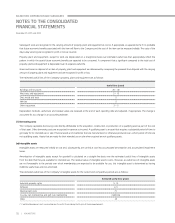
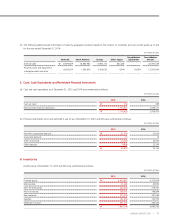
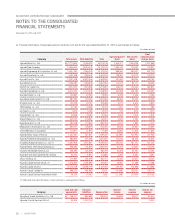
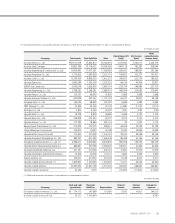
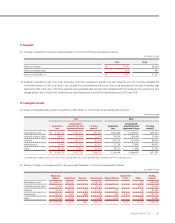
(b) The following tables provide information of sales by geographic locations based on the location of customers and non-current assets as of and
for the year ended December 31, 2014:
(In millions of won)
Domestic North America Europe Other region
Consolidation
adjustment
Consolidation
amount
External sales ₩ 17,695,609 16,865,983 11,892,172 643,285 - 47,097,049
Property, plant and equipment,
intangible assets and other 9,650,614 1,285,600 1,059,052 4,544 54,584 12,054,394
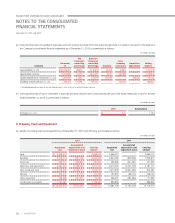
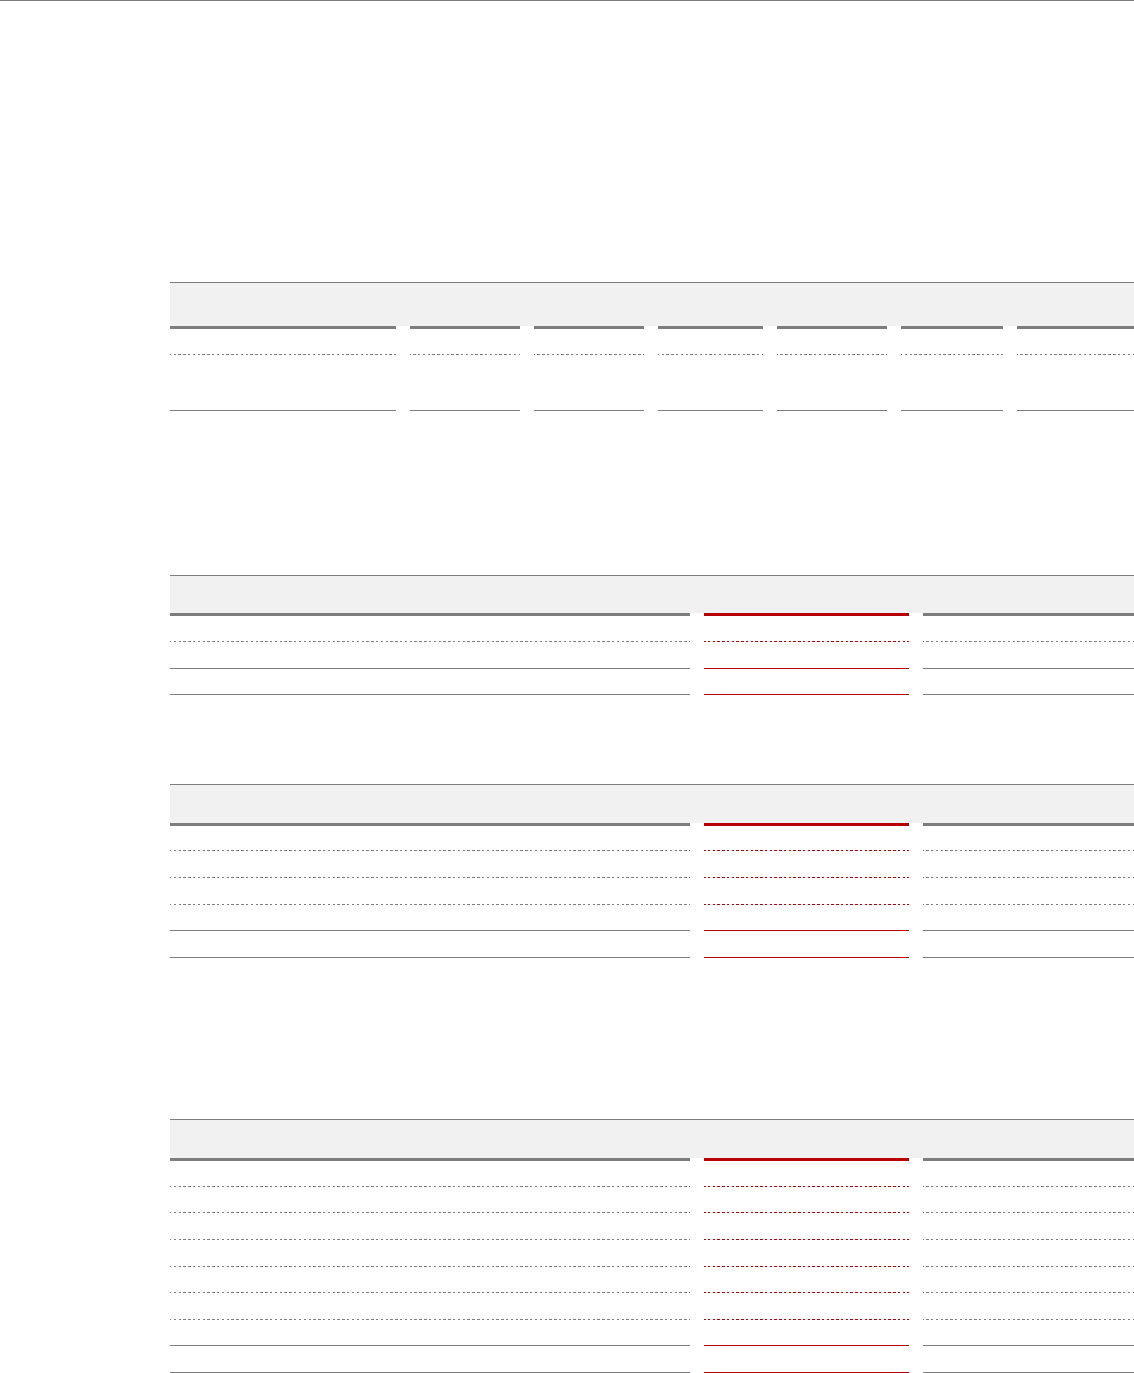
5. Cash, Cash Equivalents and Restricted Financial Instrument
(a) Cash and cash equivalents as of December 31, 2015 and 2014 are summarized as follows:
(In millions of won)
2015 2014
Cash on hand ₩ 306 299
Deposits with financial institutions 1,104,622 2,478,171
₩ 1,104,928 2,478,470
(b) Financial instruments which are restricted in use for as of December 31, 2015 and 2014 are summarized as follows:
(In millions of won)
2015 2014
Win-Win cooperation deposits ₩ 31,000 31,000
Guarantee deposits 10 10
Green mold fund 20,000 20,000
Other deposits 9,808 23,143
₩ 60,818 74,153
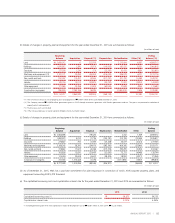
6. Inventories
Inventories as of December 31, 2015 and 2014 are summarized as follows:
(In millions of won)
2015 2014
Finished goods ₩ 6,424,987 4,733,908
Merchandise 21,492 45,932
Semi-finished goods 220,443 319,761
Work-in-process 199,341 196,849
Raw materials 375,326 391,060
Supplies 162,506 152,752
Materials-in-transit 291,251 240,320
₩ 7,695,346 6,080,582
77
ANNUAL REPORT 2015 |