Kia 2015 Annual Report Download - page 114
Download and view the complete annual report
Please find page 114 of the 2015 Kia annual report below. You can navigate through the pages in the report by either clicking on the pages listed below, or by using the keyword search tool below to find specific information within the annual report.-
 1
1 -
2
-
3
-
4
-
5
-
6
-
7
-
8
-
9
-
10
-
11
-
12
-
13
-
14
-
15
-
16
-
17
-
18
-
19
-
20
-
21
-
22
-
23
-
24
-
25
-
26
-
27
-
28
-
29
-
30
-
31
-
32
-
33
-
34
-
35
-
36
-
37
-
38
-
39
-
40
-
41
-
42
-
43
-
44
-
45
-
46
-
47
-
48
-
49
-
50
-
51
-
52
-
53
-
54
-
55
-
56
-
57
-
58
-
59
-
60
-
61
-
62
-
63
-
64
-
65
-
66
-
67
-
68
-
69
-
70
-
71
-
72
-
73
-
74
-
75
-
76
-
77
-
78
-
79
-
80
-
81
-
82
-
83
-
84
-
85
-
86
-
87
-
88
-
89
-
90
-
91
-
92
-
93
-
94
-
95
-
96
-
97
-
98
-
99
-
100
-
101
-
102
-
103
-
 104
104 -
 105
105 -
 106
106 -
 107
107 -
 108
108 -
 109
109 -
 110
110 -
 111
111 -
 112
112 -
 113
113 -
 114
114 -
 115
115 -
 116
116 -
 117
117 -
 118
118 -
 119
119 -
 120
120 -
 121
121 -
 122
122 -
 123
123 -
 124
124 -
125
-
126
-
127
-
128
 |
 |
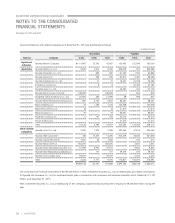
The Company measured the fair value of financial instruments as follows:
•Thefairvalueofavailable-for-salenancialassetstradedwithinthemarketismeasuredattheclosingbidpricequotedattheendofthe
reporting period.
•Thefairvalueofthederivativesisthepresentvalueofthedifferencebetweencontractualforwardpriceandfutureforwardpricediscounted
during the remaining period of the contract, from present to contractual maturity.
Except for the financial assets and liabilities above, the fair value of current receivables is close to their carrying amounts. In addition, the fair
value of other financial instruments is determined as the present value of estimated future cash flows discounted at the current market interest
rate. As of December 31, 2015, there isn’t any significant business climate and economic environment changes affecting the fair value of
financial assets and liabilities.
(ii) Fair value hierarchy
Fair value measurement classified by fair value hierarchy as of December 31, 2015 are summarized as follows:
(In millions of won)
Level 1 Level 2 Level 3 Total
Financial asset at fair value through profit or loss:
Financial asset at fair value through profit or loss
₩
- 200,261 - 200,261
Available-for-sale financial assets:
Marketable securities 423,681 - - 423,681
Financial derivatives assets:
Currency option (risk hedge) - 2,122 - 2,122
Financial derivatives liabilities:
Currency option (risk hedge) - 44 - 44
There were no significant transfers between levels 1, 2, and 3.
When measuring the fair value of an asset or a liability, the Company uses market observable data as far as possible. Fair values are categorized
into different levels in a fair value hierarchy based on the inputs used in the valuation techniques as follows.
Level 1: quoted prices (unadjusted) in active markets for identical assets or liabilities.
Level 2: inputs other than quoted prices included in Level 1 that are observable for the asset or liability, either directly (i.e. as prices) or indirectly
(i.e. derived from prices).
Level 3: inputs for the asset or liability that are not based on observable market data (unobservable inputs).
The valuation techniques and the unobservable inputs used in measuring Level 2 fair values as of December 31, 2015 are summarized as follows:
(In millions of won)
Fair value Valuation methods Inputs
Financial assets at fair value through profit or loss
₩
200,261
DCF model Discount rate (*)
Hedging derivative financial assets 2,122
Hedging derivative financial liabilities 44
(*) The expected net cash flows are discounted using a risk-adjusted discount rate based on government bonds
108 | KIA MOTORS
December 31, 2015 and 2014
KIA MOTORS CORPORATION AND SUBSIDIARIES
NOTES TO THE CONSOLIDATED
FINANCIAL STATEMENTS