Kia 2015 Annual Report Download - page 107
Download and view the complete annual report
Please find page 107 of the 2015 Kia annual report below. You can navigate through the pages in the report by either clicking on the pages listed below, or by using the keyword search tool below to find specific information within the annual report.-
 1
1 -
2
-
3
-
4
-
5
-
6
-
7
-
8
-
9
-
10
-
11
-
12
-
13
-
14
-
15
-
16
-
17
-
18
-
19
-
20
-
21
-
22
-
23
-
24
-
25
-
26
-
27
-
28
-
29
-
30
-
31
-
32
-
33
-
34
-
35
-
36
-
37
-
38
-
39
-
40
-
41
-
42
-
43
-
44
-
45
-
46
-
47
-
48
-
49
-
50
-
51
-
52
-
53
-
54
-
55
-
56
-
57
-
58
-
59
-
60
-
61
-
62
-
63
-
64
-
65
-
66
-
67
-
68
-
69
-
70
-
71
-
72
-
73
-
74
-
75
-
76
-
77
-
78
-
79
-
80
-
81
-
82
-
83
-
84
-
85
-
86
-
87
-
88
-
89
-
90
-
91
-
92
-
93
-
94
-
95
-
96
-
 97
97 -
 98
98 -
 99
99 -
 100
100 -
 101
101 -
 102
102 -
 103
103 -
 104
104 -
 105
105 -
 106
106 -
 107
107 -
 108
108 -
 109
109 -
 110
110 -
 111
111 -
 112
112 -
 113
113 -
 114
114 -
 115
115 -
 116
116 -
 117
117 -
118
-
119
-
120
-
121
-
122
-
123
-
124
-
125
-
126
-
127
-
128
 |
 |

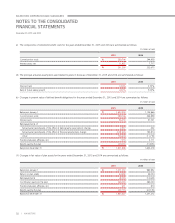
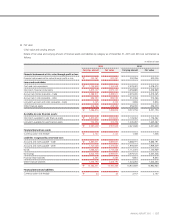
( f ) Details of changes in deferred tax assets and liabilities for the year ended December 31, 2014 are as follows:
(In millions of won)
Beginning balance Profit or loss
Other comprehensive
income Ending balance
Allowance for doubtful accounts
₩
17,346 (3,586) - 13,760
Bad debts write-off 59,880 (2,041) - 57,839
Accrued expenses 220,481 29,846 - 250,327
Provision of warranty for sale 368,985 102,185 - 471,170
Provision of other long-term employee benefits 51,368 7,979 - 59,347
Annual leaves 25,957 1,858 - 27,815
Revaluated land (359,331) 793 - (358,538)
Depreciation (263,743) (37,740) (301,483)
Investment in subsidiaries and associates (1,400,352) (151,040) - (1,551,392)
Gains/Losses on sales of investment assets and others (57,172) (120) - (57,292)
Gains/Losses on valuation of available-for-sale financial assets (130,959) - (14,671) (145,630)
Operating loss carryforward 252 18,398 - 18,650
Others 154,106 (12,332) - 141,774
₩
(1,313,182) (45,800) (14,671) (1,373,653)
(g) As of December 31, 2015, the amounts of total temporary differences related to investments of subsidiaries and associates which deferred
tax assets and liabilities were not recognized, are
₩
683,847 million and
₩
2,941,500 million, respectively.
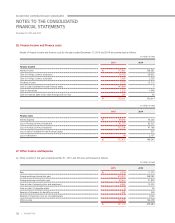
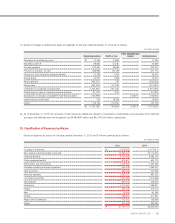
29. Classification of Expenses by Nature
Details of expenses by nature for the years ended December 31, 2015 and 2014 are summarized as follows:
(In millions of won)
2015 2014
Changes in inventories
₩
(1,563,832) (1,577,411)
Raw material and merchandise consumed 34,985,227 33,110,405
Employee benefits 4,135,948 4,066,105
Other employee benefits 673,627 655,172
Depreciation and amortization 1,422,497 1,337,265
Overseas marketing and export expenses 950,789 1,066,557
Sales promotion 886,796 737,859
Warranty expenses 1,365,271 997,232
Commissions and fees 1,032,296 1,013,666
Test expenses 859,755 774,005
Advertising 1,232,467 1,088,821
Freight 292,243 313,714
Rent 60,808 61,296
Utilities 284,606 311,951
Repairs and maintenance 125,181 128,098
Others 423,495 439,765
₩
47,167,174 44,524,500
101
ANNUAL REPORT 2015 |