Kia 2015 Annual Report Download - page 9
Download and view the complete annual report
Please find page 9 of the 2015 Kia annual report below. You can navigate through the pages in the report by either clicking on the pages listed below, or by using the keyword search tool below to find specific information within the annual report.-
 1
1 -
 2
2 -
 3
3 -
 4
4 -
 5
5 -
 6
6 -
 7
7 -
 8
8 -
 9
9 -
 10
10 -
 11
11 -
 12
12 -
 13
13 -
 14
14 -
 15
15 -
 16
16 -
 17
17 -
 18
18 -
 19
19 -
 20
20 -
21
-
22
-
23
-
24
-
25
-
26
-
27
-
28
-
29
-
30
-
31
-
32
-
33
-
34
-
35
-
36
-
37
-
38
-
39
-
40
-
41
-
42
-
43
-
44
-
45
-
46
-
47
-
48
-
49
-
50
-
51
-
52
-
53
-
54
-
55
-
56
-
57
-
58
-
59
-
60
-
61
-
62
-
63
-
64
-
65
-
66
-
67
-
68
-
69
-
70
-
71
-
72
-
73
-
74
-
75
-
76
-
77
-
78
-
79
-
80
-
81
-
82
-
83
-
84
-
85
-
86
-
87
-
88
-
89
-
90
-
91
-
92
-
93
-
94
-
95
-
96
-
97
-
98
-
99
-
100
-
101
-
102
-
103
-
104
-
105
-
106
-
107
-
108
-
109
-
110
-
111
-
112
-
113
-
114
-
115
-
116
-
117
-
118
-
119
-
120
-
121
-
122
-
123
-
124
-
125
-
126
-
127
-
128
 |
 |
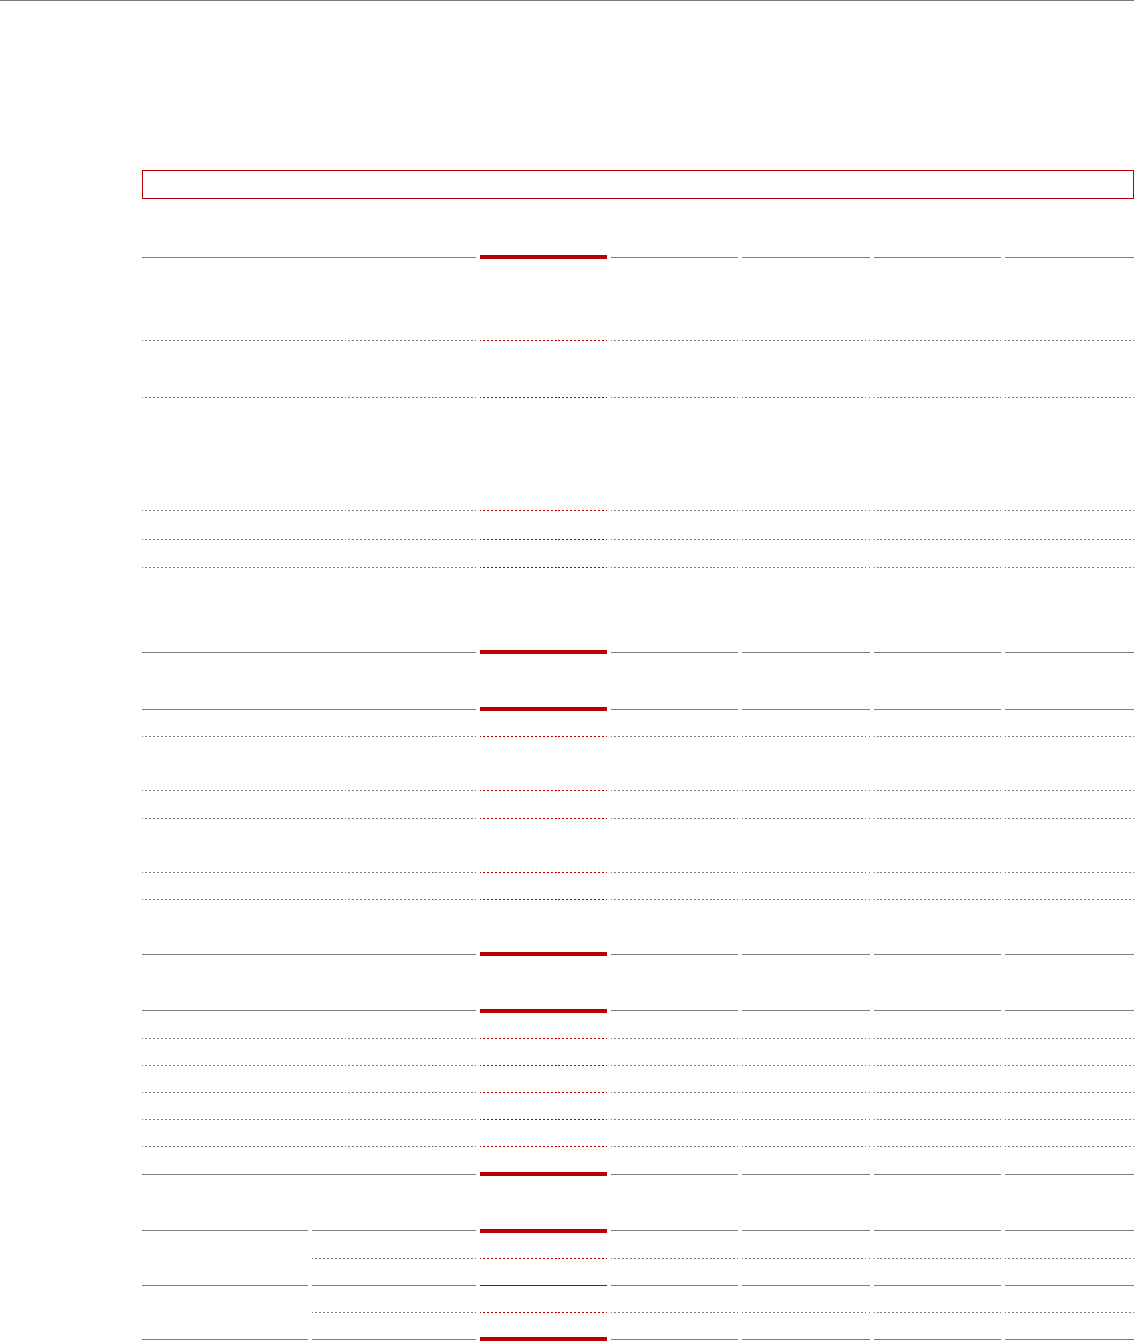
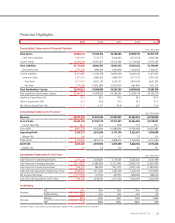
2015 2014 2013 2012 2011
Consolidated Statement of Financial Position*
Total Assets 45,980,113 41,044,202 36,182,040 32,398,314 30,255,179
Cash Items (Liquidity) 7,052,979 7,313,777 6,346,643 4,270,539 3,934,169
Current Assets 18,390,784 16,655,401 13,472,386 11,139,430 11,075,187
Total Liabilities 21,776,082 18,560,337 15,927,245 15,550,252 16,745,469
Short-term Debt 2,781,090 1,808,930 1,640,958 1,404,947 3,104,071
Current Liabilities 14,579,485 11,974,338 10,806,238 10,000,239 11,421,924
Long-term Debt 3,531,941 2,882,263 1,698,194 2,471,132 2,503,230
Total Debt 6,313,031 4,691,193 3,339,152 3,876,079 5,607,300
Net Debt (739,948) (2,622,584) (3,007,491) (394,460) 1,673,132
Total Stockholders’ Equity 24,204,031 22,483,865 20,254,795 16,848,062 13,509,709
Total Liabilities & Stockholders’ Equity 45,980,113 41,044,202 36,182,040 32,398,314 30,255,179
Liability-to-Equity Ratio (%) 90.0 82.6 78.6 92.3 124.0
Debt-to-Equity Ratio (%) 26.1 20.9 16.5 23.0 41.5
Net Debt-to-Equity Ratio (%) (3.1) (11.7) (14.9) (2.3) 12.4
Consolidated Statement of Income*
Revenue 49,521,447 47,097,049 47,597,897 47,242,933 43,190,942
Cost of Sales 39,653,769 37,754,115 37,511,941 36,536,005 33,138,961
Cost of Sales (%) 80.1 80.2 78.8 77.3 76.7
Gross Profit 9,867,678 9,342,934 10,085,956 10,706,928 10,051,981
Operating Profit 2,354,273 2,572,549 3,177,100 3,522,251 3,499,088
Margin (%) 4.8 5.5 6.7 7.5 8.1
Pretax Profit 3,100,266 3,816,316 4,828,576 5,164,056 4,721,650
Net Profit 2,630,600 2,993,593 3,817,059 3,864,704 3,519,236
Margin (%) 5.3 6.4 8.0 8.2 8.1
Consolidated Statement of Cash Flows*
Cash Flows from Operating Activities 3,375,248 2,363,825 4,776,593 4,345,425 4,745,189
Cash Flows from Investing Activities (5,613,823) (2,983,406) (3,513,940) (2,842,577) (2,630,548)
Cash Flows from Financing Activities 906,397 986,491 (791,207) (1,810,114) (1,440,956)
Cash and Cash Equivalents, Beginning of Year 2,478,470 2,311,264 1,903,309 2,304,169 1,615,879
Net Increase (Decrease) (1,373,542) 167,206 407,955 (400,860) 688,290
Cash and Cash Equivalents, End of Year 1,104,928 2,478,470 2,311,264 1,903,309 2,304,169
Credit Rating
Domestic KIS
AA+ AA+ AA+ AA+ AA
KOREA Rating
AA+ AA+ AA+ AA+ AA
Overseas Moody’s
Baa1 Baa1 Baa1 Baa1 Baa2
S&P
A- BBB+ BBB+ BBB+ BBB
* Based on Korean International Financial Reporting Standards (K-IFRS) consolidated financial statements
(Unit: KRW million)
(Unit: KRW million)
(Unit: KRW million)
Financial Highlights
09
ANNUAL REPORT 2015 |