Kia 2015 Annual Report Download - page 113
Download and view the complete annual report
Please find page 113 of the 2015 Kia annual report below. You can navigate through the pages in the report by either clicking on the pages listed below, or by using the keyword search tool below to find specific information within the annual report.-
 1
1 -
2
-
3
-
4
-
5
-
6
-
7
-
8
-
9
-
10
-
11
-
12
-
13
-
14
-
15
-
16
-
17
-
18
-
19
-
20
-
21
-
22
-
23
-
24
-
25
-
26
-
27
-
28
-
29
-
30
-
31
-
32
-
33
-
34
-
35
-
36
-
37
-
38
-
39
-
40
-
41
-
42
-
43
-
44
-
45
-
46
-
47
-
48
-
49
-
50
-
51
-
52
-
53
-
54
-
55
-
56
-
57
-
58
-
59
-
60
-
61
-
62
-
63
-
64
-
65
-
66
-
67
-
68
-
69
-
70
-
71
-
72
-
73
-
74
-
75
-
76
-
77
-
78
-
79
-
80
-
81
-
82
-
83
-
84
-
85
-
86
-
87
-
88
-
89
-
90
-
91
-
92
-
93
-
94
-
95
-
96
-
97
-
98
-
99
-
100
-
101
-
102
-
 103
103 -
 104
104 -
 105
105 -
 106
106 -
 107
107 -
 108
108 -
 109
109 -
 110
110 -
 111
111 -
 112
112 -
 113
113 -
 114
114 -
 115
115 -
 116
116 -
 117
117 -
 118
118 -
 119
119 -
 120
120 -
 121
121 -
 122
122 -
 123
123 -
124
-
125
-
126
-
127
-
128
 |
 |

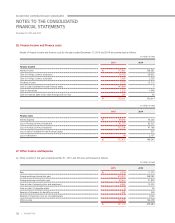
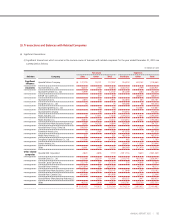
(e) Fair value
(i) Fair value and carrying amount
Details of fair value and carrying amount of financial assets and liabilities by category as of December 31, 2015 and 2014 are summarized as
follows:
(In millions of won)
2015 2014
Carrying amount Fair value Carrying amount Fair value
Financial instruments at fair value through profit or loss:
Financial instruments at fair value through profit or loss
₩
200,261 200,261 200,056 200,056
Loans and receivables:
Cash and cash equivalents
₩
1,104,928 1,104,928 2,478,470 2,478,470
Short-term financial instruments 2,875,137 2,875,137 3,458,889 3,458,889
Account and notes receivable – trade 2,388,911 2,388,911 2,419,265 2,419,265
Account and note receivable – other 696,593 696,593 514,366 514,366
Long-term account and notes receivable – trade 3,145 3,145 3,836 3,836
Other financial assets 418,162 418,162 456,330 456,330
₩
7,486,876 7,486,876 9,331,156 9,331,156
Available-for-sale financial assets:
Short-term available-for-sale financial assets
₩
2,872,653 2,872,653 1,176,362 1,176,362
Long-term available-for-sale financial assets 724,356 724,356 1,245,287 1,245,287
₩
3,597,009 3,597,009 2,421,649 2,421,649
Financial derivatives assets:
Currency option (risk hedge)
₩
2,122 2,122 1,448 1,448
Liabilities recognized by amortized cost:
Accounts and notes payable - trade
₩
5,885,651 5,885,651 5,888,191 5,888,191
Accounts and notes payable - other 1,723,046 1,723,046 1,959,339 1,959,339
Bonds 1,688,323 1,714,458 1,112,073 1,133,989
Borrowings 4,624,708 4,594,641 3,579,120 3,547,348
Financial lease liabilities 4,383 4,383 9,853 9,853
Other financial liabilities 1,438,190 1,438,190 1,424,263 1,424,263
₩
15,364,301 15,360,369 13,972,839 13,962,983
Financial derivatives liabilities:
Currency option (risk hedge)
₩
44 44 2,157 2,157
107
ANNUAL REPORT 2015 |