Kia 2015 Annual Report Download - page 90
Download and view the complete annual report
Please find page 90 of the 2015 Kia annual report below. You can navigate through the pages in the report by either clicking on the pages listed below, or by using the keyword search tool below to find specific information within the annual report.-
 1
1 -
2
-
3
-
4
-
5
-
6
-
7
-
8
-
9
-
10
-
11
-
12
-
13
-
14
-
15
-
16
-
17
-
18
-
19
-
20
-
21
-
22
-
23
-
24
-
25
-
26
-
27
-
28
-
29
-
30
-
31
-
32
-
33
-
34
-
35
-
36
-
37
-
38
-
39
-
40
-
41
-
42
-
43
-
44
-
45
-
46
-
47
-
48
-
49
-
50
-
51
-
52
-
53
-
54
-
55
-
56
-
57
-
58
-
59
-
60
-
61
-
62
-
63
-
64
-
65
-
66
-
67
-
68
-
69
-
70
-
71
-
72
-
73
-
74
-
75
-
76
-
77
-
78
-
79
-
 80
80 -
 81
81 -
 82
82 -
 83
83 -
 84
84 -
 85
85 -
 86
86 -
 87
87 -
 88
88 -
 89
89 -
 90
90 -
 91
91 -
 92
92 -
 93
93 -
 94
94 -
 95
95 -
 96
96 -
 97
97 -
 98
98 -
 99
99 -
 100
100 -
101
-
102
-
103
-
104
-
105
-
106
-
107
-
108
-
109
-
110
-
111
-
112
-
113
-
114
-
115
-
116
-
117
-
118
-
119
-
120
-
121
-
122
-
123
-
124
-
125
-
126
-
127
-
128
 |
 |
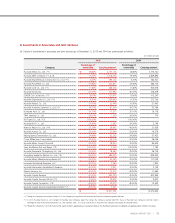
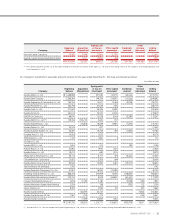
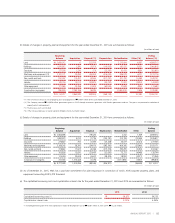
(g) Financial information of significant associates and joint ventures reconciled from the proportionate share in investees’ net assets to the balance in
the Company’s consolidated financial statements as of December 31, 2015 is summarized as follows:
(In millions of won)
Company
Net assets
(*)
The
Company’s
ownership
percentage
Based on
Company’s
ownership
percentage Goodwill
Intra-
Company
transaction
Acquisition
adjustments
Ending
balance
Hyundai Mobis Co., Ltd.
₩
24,536,507 16.88% 4,140,614 29,519 (2,995) - 4,167,138
Hyundai Steel Company 15,232,809 17.27% 2,631,057 8,277 (60,798) - 2,578,536
Hyundai Engineering & Construction Co., Ltd. 5,820,906 5.23% 304,578 284,338 - 206,206 795,122
Dongfeng Yueda Kia Motors Co., Ltd. 1,794,303 50.00% 897,152 - (16,332) - 880,820
(*) Excluded proportionate share of non-controlling interests in net assets of associates and joint ventures.
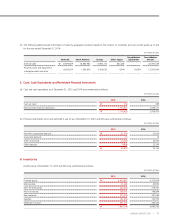
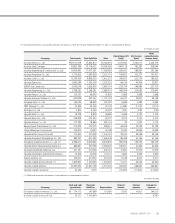
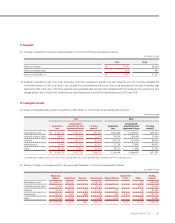
(h) Unrecognized share of loss in investment in associate and joint ventures due to discontinuing the use of the equity method as of and for the year
ended December 31, 2015 is summarized as follows:
(In millions of won)
2015 Accumulated
Kia Tigers Co., Ltd
₩
203 1,124
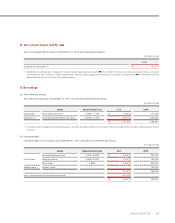
9. Property, Plant and Equipment
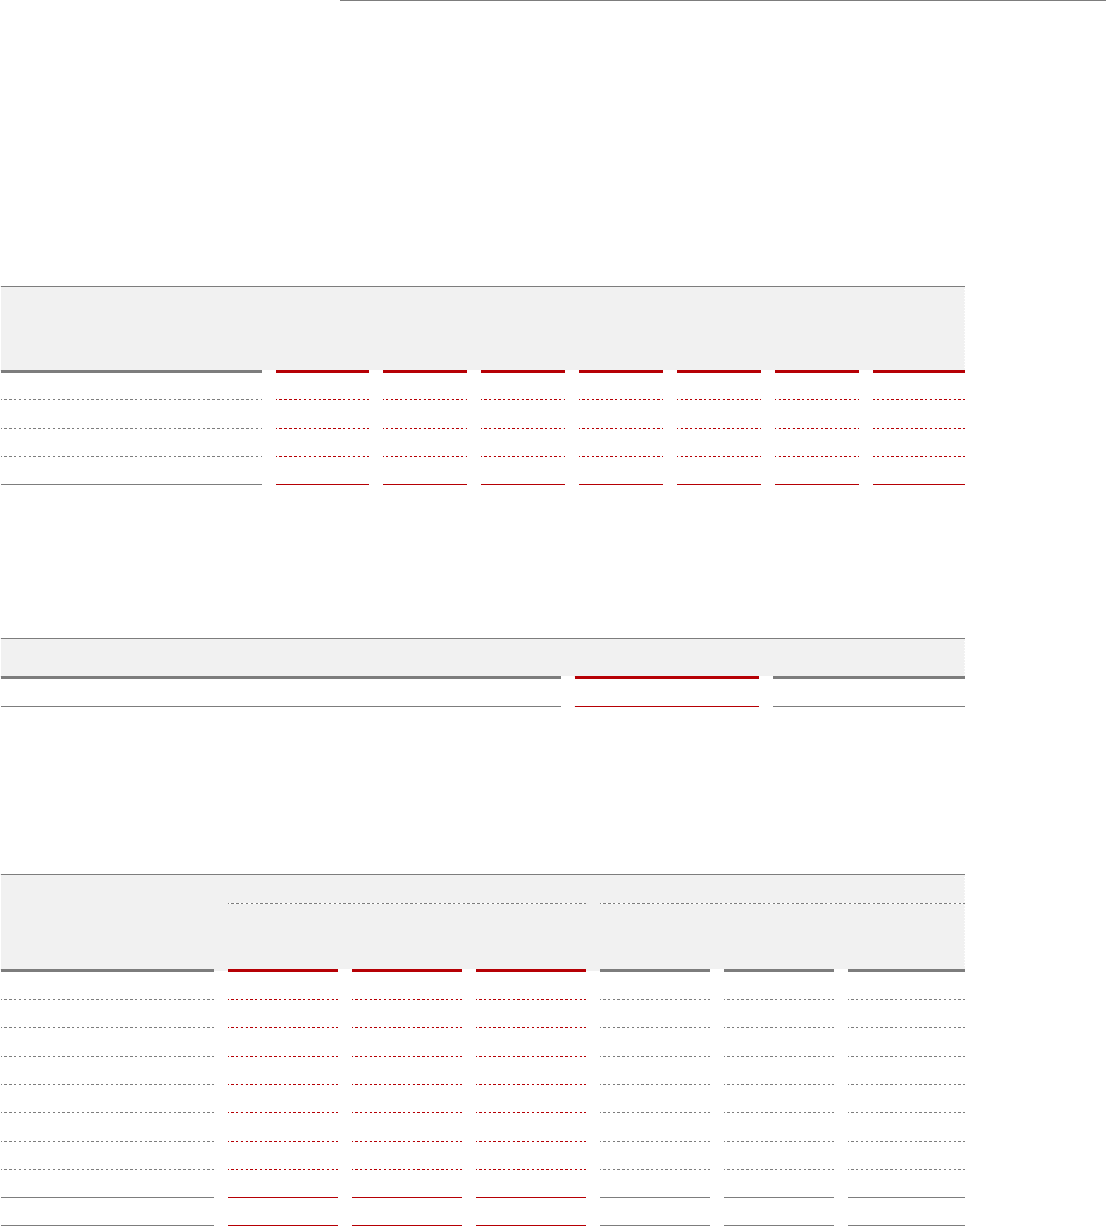
(a) Details of property, plant and equipment as of December 31, 2015 and 2014 are summarized as follows:
(In millions of won)
2015 2014
Acquisition
cost
Accumulated
depreciation and
impairment losses
Carrying
amount
Acquisition
cost
Accumulated
depreciation and
impairment losses
Carrying
amount
Land
₩
4,868,513 - 4,868,513 2,669,012 - 2,669,012
Buildings 3,028,374 (967,756) 2,060,618 2,824,763 (847,946) 1,976,817
Structures 629,711 (346,861) 282,850 598,966 (321,461) 277,505
Machinery and equipment 6,663,540 (3,389,764) 3,273,776 6,214,330 (3,033,159) 3,181,171
Dies, molds and tools 3,776,522 (2,726,771) 1,049,751 3,413,559 (2,601,292) 812,267
Vehicles 214,211 (73,772) 140,439 197,819 (69,075) 128,744
Other equipment 498,566 (327,873) 170,693 466,451 (294,486) 171,965
Construction-in-progress 1,195,481 - 1,195,481 896,836 - 896,836
₩
20,874,918 (7,832,797) 13,042,121 17,281,736 (7,167,419) 10,114,317
84 | KIA MOTORS
December 31, 2015 and 2014
KIA MOTORS CORPORATION AND SUBSIDIARIES
NOTES TO THE CONSOLIDATED
FINANCIAL STATEMENTS