Kia 2015 Annual Report Download - page 8
Download and view the complete annual report
Please find page 8 of the 2015 Kia annual report below. You can navigate through the pages in the report by either clicking on the pages listed below, or by using the keyword search tool below to find specific information within the annual report.-
 1
1 -
 2
2 -
 3
3 -
 4
4 -
 5
5 -
 6
6 -
 7
7 -
 8
8 -
 9
9 -
 10
10 -
 11
11 -
 12
12 -
 13
13 -
 14
14 -
 15
15 -
 16
16 -
 17
17 -
 18
18 -
 19
19 -
20
-
21
-
22
-
23
-
24
-
25
-
26
-
27
-
28
-
29
-
30
-
31
-
32
-
33
-
34
-
35
-
36
-
37
-
38
-
39
-
40
-
41
-
42
-
43
-
44
-
45
-
46
-
47
-
48
-
49
-
50
-
51
-
52
-
53
-
54
-
55
-
56
-
57
-
58
-
59
-
60
-
61
-
62
-
63
-
64
-
65
-
66
-
67
-
68
-
69
-
70
-
71
-
72
-
73
-
74
-
75
-
76
-
77
-
78
-
79
-
80
-
81
-
82
-
83
-
84
-
85
-
86
-
87
-
88
-
89
-
90
-
91
-
92
-
93
-
94
-
95
-
96
-
97
-
98
-
99
-
100
-
101
-
102
-
103
-
104
-
105
-
106
-
107
-
108
-
109
-
110
-
111
-
112
-
113
-
114
-
115
-
116
-
117
-
118
-
119
-
120
-
121
-
122
-
123
-
124
-
125
-
126
-
127
-
128
 |
 |

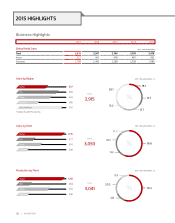
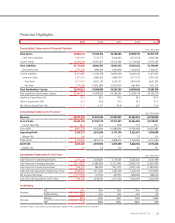
2015 2014 2013 2012 2011
Global Retail Sales
Total
2,915 2,907 2,746 2,709 2,478
Korea
527 465 458 481 492
Overseas
2,388 2,442 2,289 2,228 1,986
Sales by Region
Sales by Plant
TOTAL
3,050
37 1
U.S.
616
China
338
Slovakia
1,725
Korea
56.6
20.2
12.2
11.1
Production by Plant
TOTAL
3,041
615
369
1,718
338
U.S.
China
Slovakia
Korea
56.5
20.2
12.1
11.1
* Europe: EU and EFTA countries
TOTAL
2,915
626
U.S.
616
China
385
Europe*
761
Rest of World
527
Korea
13.2
18.1
21.5
21.1
26.1
Business Highlights
(Unit: thousand vehicles)
(Unit: thousand vehicles, %)
(Unit: thousand vehicles, %)
(Unit: thousand vehicles, %)
%
%
%
08 | KIA MOTORS
2015 HIGHLIGHTS