Kia 2015 Annual Report Download - page 110
Download and view the complete annual report
Please find page 110 of the 2015 Kia annual report below. You can navigate through the pages in the report by either clicking on the pages listed below, or by using the keyword search tool below to find specific information within the annual report.-
 1
1 -
2
-
3
-
4
-
5
-
6
-
7
-
8
-
9
-
10
-
11
-
12
-
13
-
14
-
15
-
16
-
17
-
18
-
19
-
20
-
21
-
22
-
23
-
24
-
25
-
26
-
27
-
28
-
29
-
30
-
31
-
32
-
33
-
34
-
35
-
36
-
37
-
38
-
39
-
40
-
41
-
42
-
43
-
44
-
45
-
46
-
47
-
48
-
49
-
50
-
51
-
52
-
53
-
54
-
55
-
56
-
57
-
58
-
59
-
60
-
61
-
62
-
63
-
64
-
65
-
66
-
67
-
68
-
69
-
70
-
71
-
72
-
73
-
74
-
75
-
76
-
77
-
78
-
79
-
80
-
81
-
82
-
83
-
84
-
85
-
86
-
87
-
88
-
89
-
90
-
91
-
92
-
93
-
94
-
95
-
96
-
97
-
98
-
99
-
 100
100 -
 101
101 -
 102
102 -
 103
103 -
 104
104 -
 105
105 -
 106
106 -
 107
107 -
 108
108 -
 109
109 -
 110
110 -
 111
111 -
 112
112 -
 113
113 -
 114
114 -
 115
115 -
 116
116 -
 117
117 -
 118
118 -
 119
119 -
 120
120 -
121
-
122
-
123
-
124
-
125
-
126
-
127
-
128
 |
 |

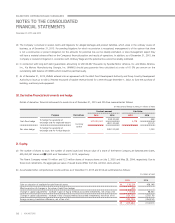
(d) Management of capital risk
The fundamental goal of capital management is to maintain on financial structure. As for this to be maintained, the Company use debt ratio
as indicator of capital management. The debt ratio is calculated as total liability divided by total equity.
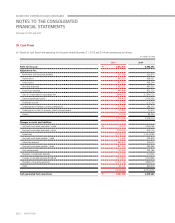
32. Risk Management of Financial Instruments
(a) Credit and counterparty risk
(i) Exposure to credit and counterparty risk
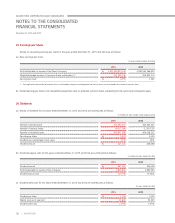
The carrying amount of financial assets means maximum exposure in respect of credit and counterparty risk. The maximum exposure as of
December 31, 2015 and 2014 are as follows:
(In millions of won)
2015 2014
Cash and cash equivalents (*)
₩
1,104,622 2,478,171
Short-term financial instruments 2,875,137 3,458,889
Short-term available-for-sale financial assets 2,872,648 1,176,358
Accounts and notes receivable – trade 2,388,911 2,419,265
Accounts and notes receivable – other 696,593 514,366
Other current assets 248,901 301,864
Long-term financial instruments 93,352 84,349
Long-term available-for-sale financial assets 225,049 260,324
Long-term accounts and notes receivable - trade 3,145 3,836
Guarantee deposits 171,553 168,929
Other non-current assets 106,739 102,692
₩
10,786,650 10,969,043
(*) Cash on hand is excluded.
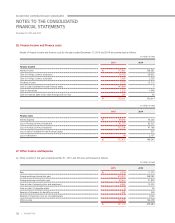
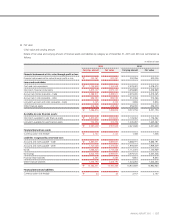
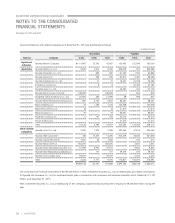
(ii) Loss on impairment
The carrying amount of trade account and notes receivable and other receivable based on by maturity as of December 31, 2015 and 2014 are as
follows:
(In millions of won)
2015 2014
Accounts and notes
receivable- trade Other receivable (*)
Accounts and notes
receivable- trade Other receivable (*)
Not overdue
₩
1,877,388 902,235 1,934,720 786,748
Past due less than 3 month 439,863 27,240 346,183 20,028
Past due 4~ 6 month 47,742 62,800 139,418 49,826
Past due 7~12 month 26,305 16,566 2,311 1,222
Past due over 12 month 97,714 5,988 99,132 29,089
₩
2,489,012 1,014,829 2,521,764 886,913
(*) Other receivables are comprised of other accounts and notes receivables, long-term other accounts and notes receivables, accrued income, short-term loans and guarantee deposits.
104 | KIA MOTORS
December 31, 2015 and 2014
KIA MOTORS CORPORATION AND SUBSIDIARIES
NOTES TO THE CONSOLIDATED
FINANCIAL STATEMENTS