Kia 2012 Annual Report Download - page 99
Download and view the complete annual report
Please find page 99 of the 2012 Kia annual report below. You can navigate through the pages in the report by either clicking on the pages listed below, or by using the keyword search tool below to find specific information within the annual report.-
 1
1 -
2
-
3
-
4
-
5
-
6
-
7
-
8
-
9
-
10
-
11
-
12
-
13
-
14
-
15
-
16
-
17
-
18
-
19
-
20
-
21
-
22
-
23
-
24
-
25
-
26
-
27
-
28
-
29
-
30
-
31
-
32
-
33
-
34
-
35
-
36
-
37
-
38
-
39
-
40
-
41
-
42
-
43
-
44
-
45
-
46
-
47
-
48
-
49
-
50
-
51
-
52
-
53
-
54
-
55
-
56
-
57
-
58
-
59
-
60
-
61
-
62
-
63
-
64
-
65
-
66
-
67
-
68
-
69
-
70
-
71
-
72
-
73
-
74
-
75
-
76
-
77
-
78
-
79
-
80
-
81
-
82
-
83
-
84
-
85
-
86
-
87
-
88
-
 89
89 -
 90
90 -
 91
91 -
 92
92 -
 93
93 -
 94
94 -
 95
95 -
 96
96 -
 97
97 -
 98
98 -
 99
99 -
 100
100 -
 101
101 -
 102
102 -
 103
103 -
 104
104 -
 105
105 -
 106
106 -
 107
107 -
 108
108 -
 109
109 -
110
-
111
-
112
-
113
-
114
 |
 |
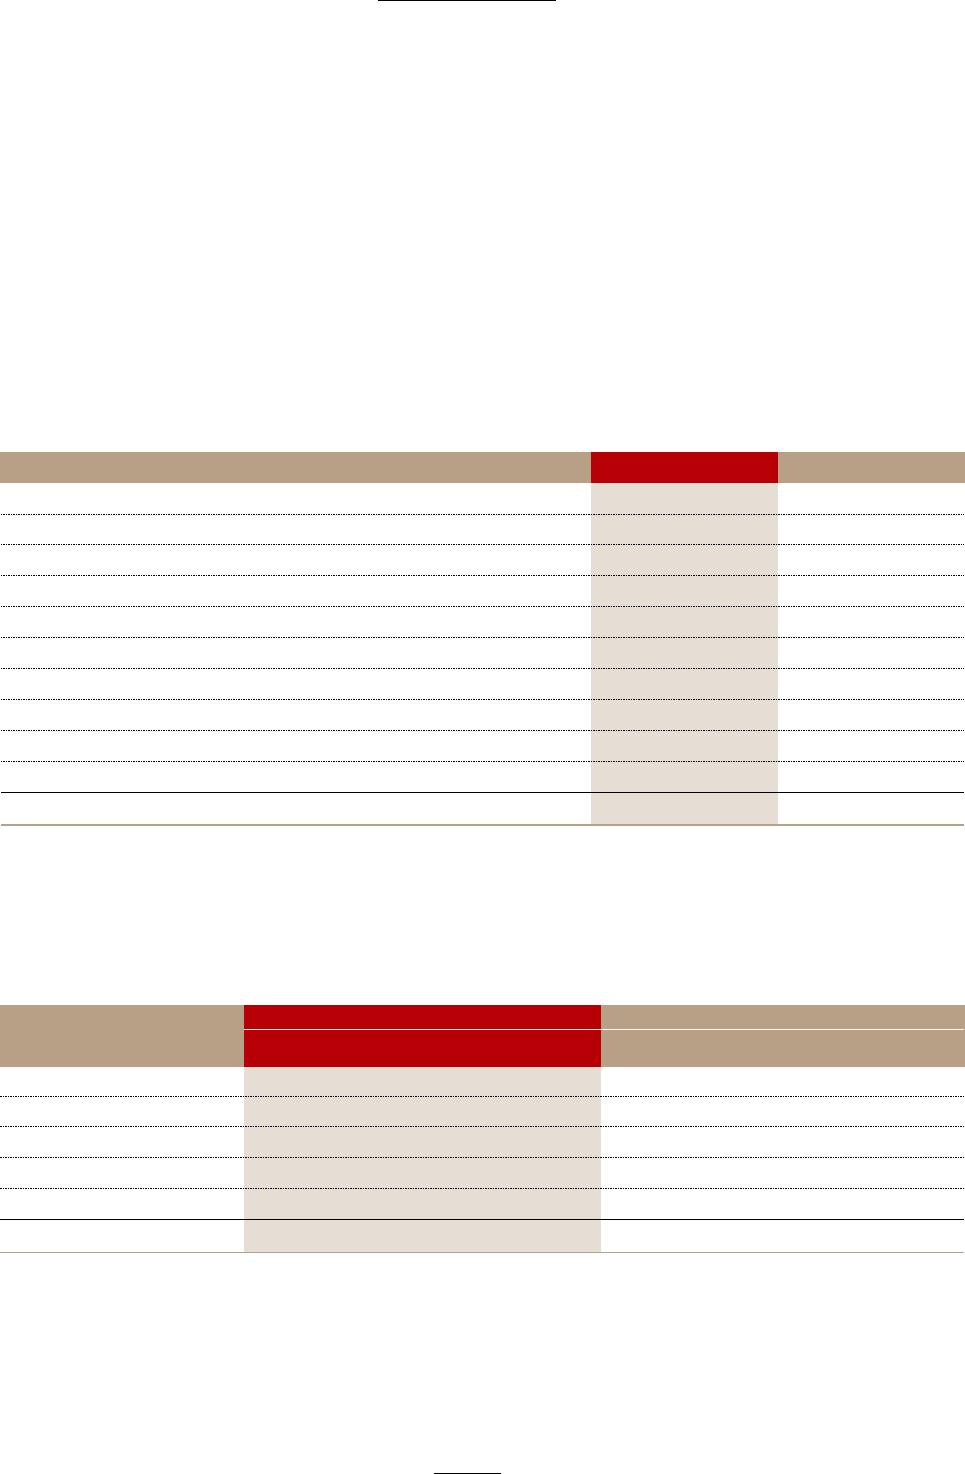
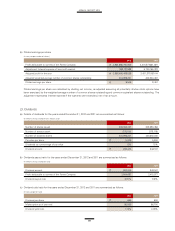
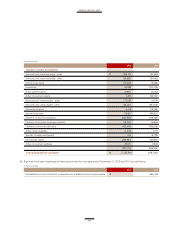
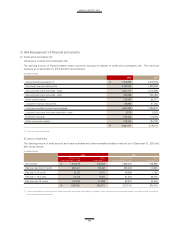
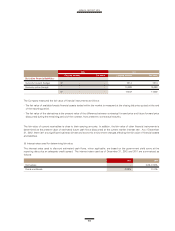
(a) Credit and counterparty risk
(i) Exposure to credit and counterparty risk
The carrying amount of financial assets means maximum exposure in respect of credit and counterparty risk. The maximum
exposure as of December 31, 2012 and 2011 are as follows:
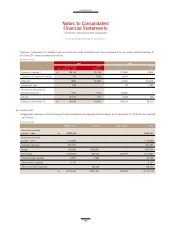
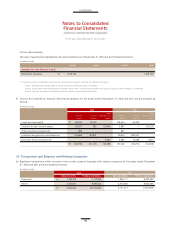
(ii) Loss on impairment
The carrying amount of trade account and notes receivable and other receivable divided by maturity as of December 31, 2012 and
2011 are as follows:
2012 2011
Cash and cash equivalents (*) ₩ 1,902,988 2,303,819
Short-term financial instruments 2,367,230 1,630,000
Accounts and notes receivable - trade 1,801,731 2,178,699
Accounts and notes receivable - other 485,696 432,453
Other current assets 152,090 95,371
Long-term financial instruments 58,990 21,033
Long-term available-for-sale financial assets 1,606,358 1,229,673
Long-term accounts and notes receivable - trade 2,675 2,322
Guarantee deposits 166,463 173,156
Other non-current assets 122,936 120,788
₩ 8,667,157 8,187,314
(In millions of won)
(*) Cash on hand is excluded.
(*) Other receivables are comprised of other accounts and notes receivables, long-term other accounts and notes receivables, accrued income, short-term
loans and guarantee deposits.
(In millions of won)
2012 2011
Accounts and Other Accounts and Other
notes receivable - trade receivable (*) notes receivable - trade receivable (*)
Not overdue ₩ 1,500,279 806,588 1,882,453 736,582
Past due less than 3 month 260,421 80,463 225,649 37,303
Past due 4~ 6 month 19,123 6,471 48,866 1,128
Past due 7~12 month 43,142 17,481 51,302 25,002
Past due over 12 month 100,836 21,868 98,870 24,300
₩ 1,923,801 932,871 2,307,140 824,315