Kia 2012 Annual Report Download - page 51
Download and view the complete annual report
Please find page 51 of the 2012 Kia annual report below. You can navigate through the pages in the report by either clicking on the pages listed below, or by using the keyword search tool below to find specific information within the annual report.-
 1
1 -
2
-
3
-
4
-
5
-
6
-
7
-
8
-
9
-
10
-
11
-
12
-
13
-
14
-
15
-
16
-
17
-
18
-
19
-
20
-
21
-
22
-
23
-
24
-
25
-
26
-
27
-
28
-
29
-
30
-
31
-
32
-
33
-
34
-
35
-
36
-
37
-
38
-
39
-
40
-
 41
41 -
 42
42 -
 43
43 -
 44
44 -
 45
45 -
 46
46 -
 47
47 -
 48
48 -
 49
49 -
 50
50 -
 51
51 -
 52
52 -
 53
53 -
 54
54 -
 55
55 -
 56
56 -
 57
57 -
 58
58 -
 59
59 -
 60
60 -
 61
61 -
62
-
63
-
64
-
65
-
66
-
67
-
68
-
69
-
70
-
71
-
72
-
73
-
74
-
75
-
76
-
77
-
78
-
79
-
80
-
81
-
82
-
83
-
84
-
85
-
86
-
87
-
88
-
89
-
90
-
91
-
92
-
93
-
94
-
95
-
96
-
97
-
98
-
99
-
100
-
101
-
102
-
103
-
104
-
105
-
106
-
107
-
108
-
109
-
110
-
111
-
112
-
113
-
114
 |
 |

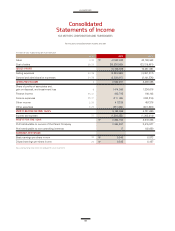
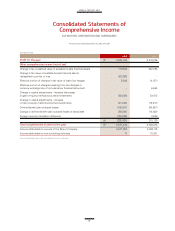
2012 2011
₩ 3,864,704 3,519,236
Change in fair unrealized value of available-for-sale financial assets 179,405 342,338
Change in fair value of available-for-sale financial assets
reclassified to profits or loss (52,363) -
Effective portion of changes in fair value of cash flow hedges 5,543 (4,157)
Effective portion of changes resulting from the changes in
currency exchange rate of non-derivative financial instrument - 6,664
Change in capital adjustments - increase (decrease)
in gain of equity method accounted investments (50,526) 39,813
Change in capital adjustments - increase
in loss of equity method accounted investments (41,224) (13,812)
Defined benefit plan actuarial losses (155,817) (90,867)
Change in defined benefit plan actuarial losses of associates (28,394) (14,439)
Foreign currency translation difference (150,058) 9,599
₩ (293,434) 275,139
₩ 3,571,270 3,794,375
Income attributable to owners of the Parent Company 3,571,253 3,683,174
Income attributable to non-controlling interests 17 111,201
See accompanying notes to the consolidated financial statements.
(In millions of won)
For the years ended December 31, 2012 and 2011