Kia 2012 Annual Report Download - page 4
Download and view the complete annual report
Please find page 4 of the 2012 Kia annual report below. You can navigate through the pages in the report by either clicking on the pages listed below, or by using the keyword search tool below to find specific information within the annual report.-
 1
1 -
 2
2 -
 3
3 -
 4
4 -
 5
5 -
 6
6 -
 7
7 -
 8
8 -
 9
9 -
 10
10 -
 11
11 -
 12
12 -
 13
13 -
 14
14 -
 15
15 -
16
-
17
-
18
-
19
-
20
-
21
-
22
-
23
-
24
-
25
-
26
-
27
-
28
-
29
-
30
-
31
-
32
-
33
-
34
-
35
-
36
-
37
-
38
-
39
-
40
-
41
-
42
-
43
-
44
-
45
-
46
-
47
-
48
-
49
-
50
-
51
-
52
-
53
-
54
-
55
-
56
-
57
-
58
-
59
-
60
-
61
-
62
-
63
-
64
-
65
-
66
-
67
-
68
-
69
-
70
-
71
-
72
-
73
-
74
-
75
-
76
-
77
-
78
-
79
-
80
-
81
-
82
-
83
-
84
-
85
-
86
-
87
-
88
-
89
-
90
-
91
-
92
-
93
-
94
-
95
-
96
-
97
-
98
-
99
-
100
-
101
-
102
-
103
-
104
-
105
-
106
-
107
-
108
-
109
-
110
-
111
-
112
-
113
-
114
 |
 |
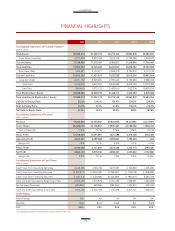
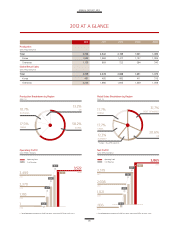
(KRW in millions)
Total Assets 32,398,314 30,255,179 26,275,144 25,962,876 25,583,550
Cash Items (Liquidity) 4,270,539 3,934,169 2,914,146 2,792,286 1,408,847
Current Assets 11,139,430 11,075,187 9,763,671 11,208,990 11,709,967
Total Liabilities 15,550,252 16,745,469 16,027,027 18,658,782 19,763,966
Short-term Debt 1,404,947 3,104,071 3,585,210 3,752,210 6,751,183
Current Liabilities 10,000,239 11,421,924 11,627,539 12,910,209 13,692,654
Long-term Debt 2,471,132 2,503,230 2,755,446 6,192,950 5,586,300
Total Debt 3,876,079 5,607,300 6,340,656 9,945,160 12,337,483
Net Debt (394,460) 1,673,132 3,426,510 7,152,874 10,928,636
Total Stockholders’ Equity 16,848,062 13,509,709 10,248,117 7,304,094 5,819,584
Total Liabilities & Stockholders’ Equity 32,398,314 30,255,179 26,275,144 25,962,876 25,583,550
Liability-to-Equity Ratio 92.3% 124.0% 156.4% 255.5% 339.6%
Debt-to-Equity Ratio 23.0% 41.5% 61.9% 136.2% 212.0%
Net Debt-to-Equity Ratio (2.3%) 12.4% 33.4% 97.9% 187.8%
(KRW in millions)
Revenue 47,242,933 43,190,942 35,826,955 29,257,392 22,217,661
Cost of Sales 36,536,005 33,138,961 27,905,367 22,769,058 17,560,181
Cost of Sales (%) 77.3% 76.7% 77.9% 77.8% 79.0%
Gross Profit 10,706,928 10,051,981 7,921,588 6,676,148 4,657,480
Operating Profit 3,522,251 3,499,088 2,369,852 1,195,206 664
Margin (%) 7.5% 8.1% 6.6% 4.1% 0.0%
Pretax Profit 5,164,056 4,721,650 3,323,048 1,220,714 (297,044)
Net Profit 3,864,704 3,519,236 2,698,331 1,020,632 (105,966)
Margin (%) 8.2% 8.1% 7.5% 3.5% (0.5%)
(KRW in millions)
Cash Flows from Operating Activities 4,345,425 4,745,189 5,272,537 4,306,926 (408,449)
Cash Flows from Investing Activities (2,842,577) (2,630,548) (2,296,053) (1,739,819) (1,958,906)
Cash Flows from Financing Activities (1,810,114) (1,440,956) (3,343,298) (1,796,307) 2,494,448
Cash and Cash Equivalents, Beginning of Year 2,304,169 1,615,879 2,001,225 1,268,631 1,036,288
Net Increase (Decrease) (400,860) 688,290 (385,346) 1,032,510 232,343
Cash and Cash Equivalents, End of Year 1,903,309 2,304,169 1,615,879 2,301,141 1,268,631
Korea Ratings AA+ AA AA AA- AA-
Moody’s Baa1 Baa2 Baa3 Ba1 Baa3
S&P BBB+ BBB BBB BBB- BBB-
* Consolidated data based on K-GAAP for 2008~2009 and K-IFRS for 2010~2012