Kia 2012 Annual Report Download - page 77
Download and view the complete annual report
Please find page 77 of the 2012 Kia annual report below. You can navigate through the pages in the report by either clicking on the pages listed below, or by using the keyword search tool below to find specific information within the annual report.-
 1
1 -
2
-
3
-
4
-
5
-
6
-
7
-
8
-
9
-
10
-
11
-
12
-
13
-
14
-
15
-
16
-
17
-
18
-
19
-
20
-
21
-
22
-
23
-
24
-
25
-
26
-
27
-
28
-
29
-
30
-
31
-
32
-
33
-
34
-
35
-
36
-
37
-
38
-
39
-
40
-
41
-
42
-
43
-
44
-
45
-
46
-
47
-
48
-
49
-
50
-
51
-
52
-
53
-
54
-
55
-
56
-
57
-
58
-
59
-
60
-
61
-
62
-
63
-
64
-
65
-
66
-
 67
67 -
 68
68 -
 69
69 -
 70
70 -
 71
71 -
 72
72 -
 73
73 -
 74
74 -
 75
75 -
 76
76 -
 77
77 -
 78
78 -
 79
79 -
 80
80 -
 81
81 -
 82
82 -
 83
83 -
 84
84 -
 85
85 -
 86
86 -
 87
87 -
88
-
89
-
90
-
91
-
92
-
93
-
94
-
95
-
96
-
97
-
98
-
99
-
100
-
101
-
102
-
103
-
104
-
105
-
106
-
107
-
108
-
109
-
110
-
111
-
112
-
113
-
114
 |
 |

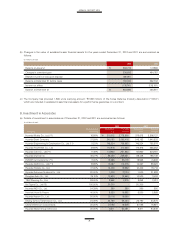
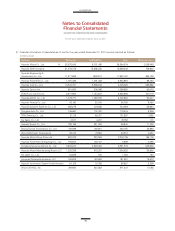
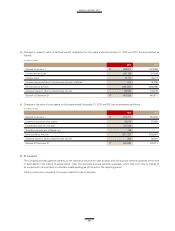
(a) Details of property, plant and equipment as of December 31, 2012 and 2011 are summarized as follows:
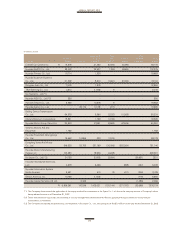
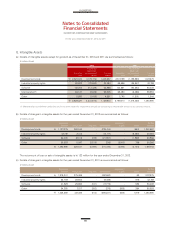
(b) Details of changes in property, plant and equipment for the year ended December 31, 2012 are summarized as follows:
(In millions of won)
(In millions of won)
2012 2011
Accumulated Accumulated
depreciation depreciation
Acquisition and impairment Carrying Acquisition and impairment Carrying
cost losses amount cost losses amount
Land ₩ 2,873,184 - 2,873,184 2,907,187 - 2,907,187
Buildings 2,446,751 (656,698) 1,790,053 2,341,508 (577,601) 1,763,907
Structures 554,877 (278,734) 276,143 525,280 (260,379) 264,901
Machinery and equipment 5,554,954 (2,403,385) 3,151,569 4,908,105 (2,106,272) 2,801,833
Dies, molds and tools 2,808,557 (2,128,296) 680,261 2,616,691 (2,069,016) 547,675
Vehicles 147,822 (43,322) 104,500 127,399 (43,085) 84,314
Other equipment 378,456 (226,693) 151,763 311,255 (195,804) 115,451
Construction-in-progress 693,725 - 693,725 699,117 - 699,117
₩ 15,458,326 (5,737,128) 9,721,198 14,436,542 (5,252,157) 9,184,385
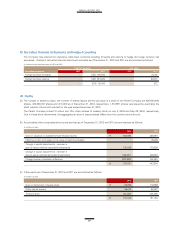
Beginning Ending
balance Acquisition Disposal (*1) Depreciation Reclassification Other balance (*2)
Land ₩ 2,907,187 - (77,257) - 54,465 (11,211) 2,873,184
Buildings 1,763,907 17,889 (10,284) (86,499) 148,058 (43,018) 1,790,053
Structures 264,901 3,011 (468) (24,451) 36,662 (3,512) 276,143
Machinery and equipment (*3) 2,801,833 48,875 (21,136) (356,188) 733,569 (55,384) 3,151,569
Dies, molds and tools 547,675 86,192 (344) (215,373) 289,851 (27,740) 680,261
Vehicles 84,314 17,721 (26,243) (26,120) 56,997 (2,169) 104,500
Other equipment 115,451 42,792 (3,013) (42,366) 44,913 (6,014) 151,763
Construction-in-progress 699,117 1,365,596 - - (1,364,515) (6,473) 693,725
₩ 9,184,385 1,582,076 (138,745) (750,997) - (155,521) 9,721,198
(*1) TThe net amount of loss on sale of property, plant and equipment is ₩ 16,695 million for the year ended December 31, 2012.
(*2) The Company cumulatively received ₩ 232,477 million government grants as of December 31, 2012 through investment agreement with Slovakia
government. The grants are deducted in calculating the carrying amount of the asset.
(*3) Capital lease assets are included.