Kia 2012 Annual Report Download - page 56
Download and view the complete annual report
Please find page 56 of the 2012 Kia annual report below. You can navigate through the pages in the report by either clicking on the pages listed below, or by using the keyword search tool below to find specific information within the annual report.-
 1
1 -
2
-
3
-
4
-
5
-
6
-
7
-
8
-
9
-
10
-
11
-
12
-
13
-
14
-
15
-
16
-
17
-
18
-
19
-
20
-
21
-
22
-
23
-
24
-
25
-
26
-
27
-
28
-
29
-
30
-
31
-
32
-
33
-
34
-
35
-
36
-
37
-
38
-
39
-
40
-
41
-
42
-
43
-
44
-
45
-
 46
46 -
 47
47 -
 48
48 -
 49
49 -
 50
50 -
 51
51 -
 52
52 -
 53
53 -
 54
54 -
 55
55 -
 56
56 -
 57
57 -
 58
58 -
 59
59 -
 60
60 -
 61
61 -
 62
62 -
 63
63 -
 64
64 -
 65
65 -
 66
66 -
67
-
68
-
69
-
70
-
71
-
72
-
73
-
74
-
75
-
76
-
77
-
78
-
79
-
80
-
81
-
82
-
83
-
84
-
85
-
86
-
87
-
88
-
89
-
90
-
91
-
92
-
93
-
94
-
95
-
96
-
97
-
98
-
99
-
100
-
101
-
102
-
103
-
104
-
105
-
106
-
107
-
108
-
109
-
110
-
111
-
112
-
113
-
114
 |
 |

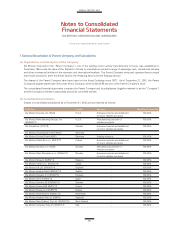
(*1) 100.00% owned by KMA
(*2) 17.47% owned by KMA
(*3) 100.00% owned by KMD, additional 0.40% of ownership acquired during 2012
(*4) 100.00% owned by KME
(*5) 80.00% owned by KME and 20.00% owned by KMD
(*6) 100.00% owned by KMAU
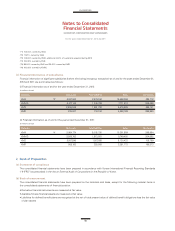
(c) Financial information of subsidiaries
Financial information of significant subsidiaries (before eliminating intra-group transaction) as of and for the years ended December 31,
2012 and 2011 are summarized as follows:
(i) Financial information as of and for the year ended December 31, 2012
(ii) Financial information as of and for the year ended December 31, 2011
Company Total assets Total liabilities Sales Net income
KMA ₩ 2,847,423 2,275,194 12,699,059 386,712
KMMG 2,077,148 1,345,709 7,771,212 206,090
KMS 2,636,049 1,591,732 5,675,685 225,141
KMR 815,037 310,153 4,268,189 295,920
(In millions of won)
Company Total assets Total liabilities Sales Net income
KMA ₩ 2,564,774 2,002,720 10,301,589 295,984
KMMG 2,265,763 1,513,581 5,749,450 204,682
KMS 2,807,296 1,937,858 5,130,433 105,789
KMR 562,163 320,505 3,361,773 195,373
(In millions of won)
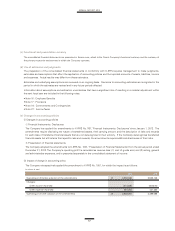
(a) Statement of compliance
The consolidated financial statements have been prepared in accordance with Korean International Financial Reporting Standards
(“K-IFRS”) as prescribed in the Act on External Audit of Corporations in the Republic of Korea.
(b) Basis of measurement
The consolidated financial statements have been prepared on the historical cost basis, except for the following material items in
the consolidated statements of financial position:
• Derivative financial instruments are measured at fair value
• Available-for-sale financial assets are measured at fair value
• Liabilities for defined benefit plans are recognized at the net of total present value of defined benefit obligations less the fair value
of plan assets
For the years ended December 31, 2012 and 2011