Kia 2012 Annual Report Download - page 80
Download and view the complete annual report
Please find page 80 of the 2012 Kia annual report below. You can navigate through the pages in the report by either clicking on the pages listed below, or by using the keyword search tool below to find specific information within the annual report.-
 1
1 -
2
-
3
-
4
-
5
-
6
-
7
-
8
-
9
-
10
-
11
-
12
-
13
-
14
-
15
-
16
-
17
-
18
-
19
-
20
-
21
-
22
-
23
-
24
-
25
-
26
-
27
-
28
-
29
-
30
-
31
-
32
-
33
-
34
-
35
-
36
-
37
-
38
-
39
-
40
-
41
-
42
-
43
-
44
-
45
-
46
-
47
-
48
-
49
-
50
-
51
-
52
-
53
-
54
-
55
-
56
-
57
-
58
-
59
-
60
-
61
-
62
-
63
-
64
-
65
-
66
-
67
-
68
-
69
-
 70
70 -
 71
71 -
 72
72 -
 73
73 -
 74
74 -
 75
75 -
 76
76 -
 77
77 -
 78
78 -
 79
79 -
 80
80 -
 81
81 -
 82
82 -
 83
83 -
 84
84 -
 85
85 -
 86
86 -
 87
87 -
 88
88 -
 89
89 -
 90
90 -
91
-
92
-
93
-
94
-
95
-
96
-
97
-
98
-
99
-
100
-
101
-
102
-
103
-
104
-
105
-
106
-
107
-
108
-
109
-
110
-
111
-
112
-
113
-
114
 |
 |

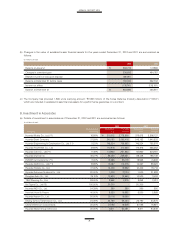
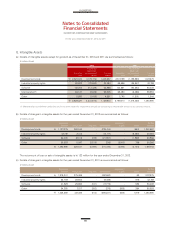
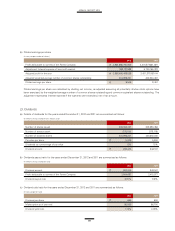
(a) Details of intangible assets except for goodwill as of December 31, 2012 and 2011 are summarized as follows:
(In millions of won)
2012 2011
Accumulated Accumulated
depreciation depreciation
Acquisition and impairment Carrying Acquisition and impairment Carrying
cost losses amount cost losses amount
Development costs ₩ 2,523,333 (1,179,776) 1,343,557 2,517,198 (1,189,923) 1,327,275
Industrial property rights 68,582 (38,558) 30,024 69,696 (26,947) 42,749
Software 167,305 (113,439) 53,866 144,691 (94,253) 50,438
Membership(*) 64,127 (8,322) 55,805 65,080 (6,096) 58,984
Other 5,980 (1,419) 4,561 2,745 (1,201) 1,544
₩ 2,829,327 (1,341,514) 1,487,813 2,799,410 (1,318,420) 1,480,990
(*) Membership has indefinite useful lives and it has been tested for impairment annually by comparing its recoverable amount to its carrying amount.
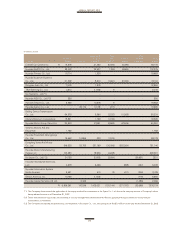
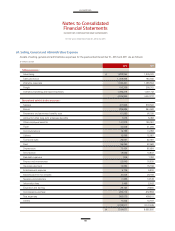
(b) Details of changes in intangible assets for the year ended December 31, 2012 are summarized as follows:
The net amount of loss on sale of intangible assets is ₩ 123 million for the year ended December 31, 2012.
(c) Details of changes in intangible assets for the year ended December 31, 2011 are summarized as follows:
(In millions of won)
(In millions of won)
Beginning Impairment Ending
balance Acquisition Disposals Amortization losses Other balance
Development costs ₩ 1,327,275 293,340 - (276,414) - (644) 1,343,557
Industrial property rights 42,749 2,412 - (13,117) - (2,020) 30,024
Software 50,438 27,312 (188) (21,857) - (1,839) 53,866
Other 60,528 5,097 (2,812) (336) (2,910) 799 60,366
₩ 1,480,990 328,161 (3,000) (311,724) (2,910) (3,704) 1,487,813
Beginning Impairment Ending
balance Acquisition Disposals Amortization losses Other balance
Development costs ₩ 1,219,341 375,459 - (267,593) - 68 1,327,275
Industrial property rights 22,709 28,553 - (9,488) - 975 42,749
Software 41,829 25,963 (161) (17,775) - 582 50,438
Other 54,380 7,517 (353) (375) (935) 294 60,528
₩ 1,338,259 437,492 (514) (295,231) (935) 1,919 1,480,990
For the years ended December 31, 2012 and 2011