Kia 2012 Annual Report Download - page 96
Download and view the complete annual report
Please find page 96 of the 2012 Kia annual report below. You can navigate through the pages in the report by either clicking on the pages listed below, or by using the keyword search tool below to find specific information within the annual report.-
 1
1 -
2
-
3
-
4
-
5
-
6
-
7
-
8
-
9
-
10
-
11
-
12
-
13
-
14
-
15
-
16
-
17
-
18
-
19
-
20
-
21
-
22
-
23
-
24
-
25
-
26
-
27
-
28
-
29
-
30
-
31
-
32
-
33
-
34
-
35
-
36
-
37
-
38
-
39
-
40
-
41
-
42
-
43
-
44
-
45
-
46
-
47
-
48
-
49
-
50
-
51
-
52
-
53
-
54
-
55
-
56
-
57
-
58
-
59
-
60
-
61
-
62
-
63
-
64
-
65
-
66
-
67
-
68
-
69
-
70
-
71
-
72
-
73
-
74
-
75
-
76
-
77
-
78
-
79
-
80
-
81
-
82
-
83
-
84
-
85
-
 86
86 -
 87
87 -
 88
88 -
 89
89 -
 90
90 -
 91
91 -
 92
92 -
 93
93 -
 94
94 -
 95
95 -
 96
96 -
 97
97 -
 98
98 -
 99
99 -
 100
100 -
 101
101 -
 102
102 -
 103
103 -
 104
104 -
 105
105 -
 106
106 -
107
-
108
-
109
-
110
-
111
-
112
-
113
-
114
 |
 |
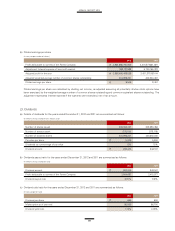
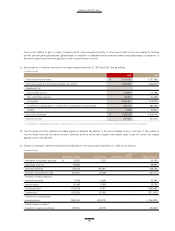
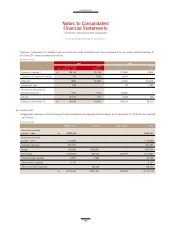
(a) Details of cash flows from operating for the years ended December 31, 2012 and 2011 are summarized as follows:
2012 2011
₩ 3,864,704 3,519,236
Depreciation 752,120 695,569
Amortization 311,724 295,231
Other long term employee benefits 28,812 26,855
Retirement and severance benefits 212,326 207,408
Employee compensation - 19,140
Warranty expenses 1,040,461 1,088,844
Loss on foreign currency translations 20,718 111,131
Interest expense 156,808 192,494
Loss on valuation of derivative instruments - 10,088
Loss on sale of property, plant and equipment 34,196 114,511
Income tax expense 1,299,352 1,202,414
Loss on inventory scrap 23,568 881
Gain on foreign currency translations (115,695) (48,822)
Interest income (168,957) (113,720)
Dividends income (5,634) (3,597)
Gain on sale of property, plant and equipment (17,501) (80,681)
Gain on investment in associates, net (1,414,080) (1,336,618)
Gain on sale of available-for-sale financial assets (59,013) -
Gain on valuation of derivative instruments - (3,520)
Others 10,179 23,428
2,109,384 2,401,036
(In millions of won)
For the years ended December 31, 2012 and 2011