Kia 2012 Annual Report Download - page 88
Download and view the complete annual report
Please find page 88 of the 2012 Kia annual report below. You can navigate through the pages in the report by either clicking on the pages listed below, or by using the keyword search tool below to find specific information within the annual report.-
 1
1 -
2
-
3
-
4
-
5
-
6
-
7
-
8
-
9
-
10
-
11
-
12
-
13
-
14
-
15
-
16
-
17
-
18
-
19
-
20
-
21
-
22
-
23
-
24
-
25
-
26
-
27
-
28
-
29
-
30
-
31
-
32
-
33
-
34
-
35
-
36
-
37
-
38
-
39
-
40
-
41
-
42
-
43
-
44
-
45
-
46
-
47
-
48
-
49
-
50
-
51
-
52
-
53
-
54
-
55
-
56
-
57
-
58
-
59
-
60
-
61
-
62
-
63
-
64
-
65
-
66
-
67
-
68
-
69
-
70
-
71
-
72
-
73
-
74
-
75
-
76
-
77
-
 78
78 -
 79
79 -
 80
80 -
 81
81 -
 82
82 -
 83
83 -
 84
84 -
 85
85 -
 86
86 -
 87
87 -
 88
88 -
 89
89 -
 90
90 -
 91
91 -
 92
92 -
 93
93 -
 94
94 -
 95
95 -
 96
96 -
 97
97 -
 98
98 -
99
-
100
-
101
-
102
-
103
-
104
-
105
-
106
-
107
-
108
-
109
-
110
-
111
-
112
-
113
-
114
 |
 |
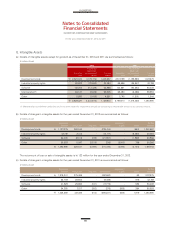
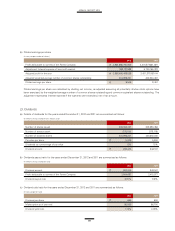
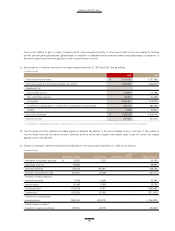
(a) Retained Earnings as of December 31, 2012 and 2011 are summarized as follows:
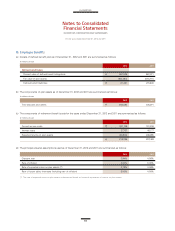
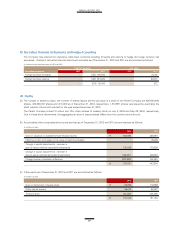
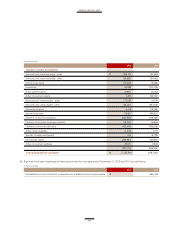
Details of calculating earnings per share for the years ended December 31, 2012 and 2011 are as follows:
(a) Basic earnings per share
2012 2011
Legal reserve ₩ 97,400 72,400
Voluntary reserve 8,351,171 4,212,710
Unappropriated retained earnings 4,214,453 4,939,605
₩ 12,663,024 9,224,715
2012 2011
Profit attributable to owners of the Parent Company ₩ 3,864,686,750,500 3,415,577,661,691
Weighted-average number of common shares outstanding(*) 404,838,423 398,414,044
Earnings per share ₩ 9,546 8,573
(In millions of won)
(In won, except number of shares)
(b) Changes in retained earnings for the years ended December 31, 2012 and 2011 are summarized as follows:
2012 2011
Balance at January 1 ₩ 9,224,715 6,113,182
Profit attributable to owners of the Parent Company 3,864,687 3,415,577
Dividends (242,167) (198,738)
Defined benefit plan actuarial losses (155,817) (90,867)
Defined benefit plan actuarial losses of associates (28,394) (14,439)
Balance at December 31 ₩ 12,663,024 9,224,715
(In millions of won)
(*) The weighted-average number of common equivalent shares are calculated by averaging circulation period, and treasury stock is not included in the
number of common shares.
For the years ended December 31, 2012 and 2011