Kia 2012 Annual Report Download - page 50
Download and view the complete annual report
Please find page 50 of the 2012 Kia annual report below. You can navigate through the pages in the report by either clicking on the pages listed below, or by using the keyword search tool below to find specific information within the annual report.-
 1
1 -
2
-
3
-
4
-
5
-
6
-
7
-
8
-
9
-
10
-
11
-
12
-
13
-
14
-
15
-
16
-
17
-
18
-
19
-
20
-
21
-
22
-
23
-
24
-
25
-
26
-
27
-
28
-
29
-
30
-
31
-
32
-
33
-
34
-
35
-
36
-
37
-
38
-
39
-
 40
40 -
 41
41 -
 42
42 -
 43
43 -
 44
44 -
 45
45 -
 46
46 -
 47
47 -
 48
48 -
 49
49 -
 50
50 -
 51
51 -
 52
52 -
 53
53 -
 54
54 -
 55
55 -
 56
56 -
 57
57 -
 58
58 -
 59
59 -
 60
60 -
61
-
62
-
63
-
64
-
65
-
66
-
67
-
68
-
69
-
70
-
71
-
72
-
73
-
74
-
75
-
76
-
77
-
78
-
79
-
80
-
81
-
82
-
83
-
84
-
85
-
86
-
87
-
88
-
89
-
90
-
91
-
92
-
93
-
94
-
95
-
96
-
97
-
98
-
99
-
100
-
101
-
102
-
103
-
104
-
105
-
106
-
107
-
108
-
109
-
110
-
111
-
112
-
113
-
114
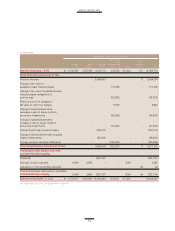
 |
 |
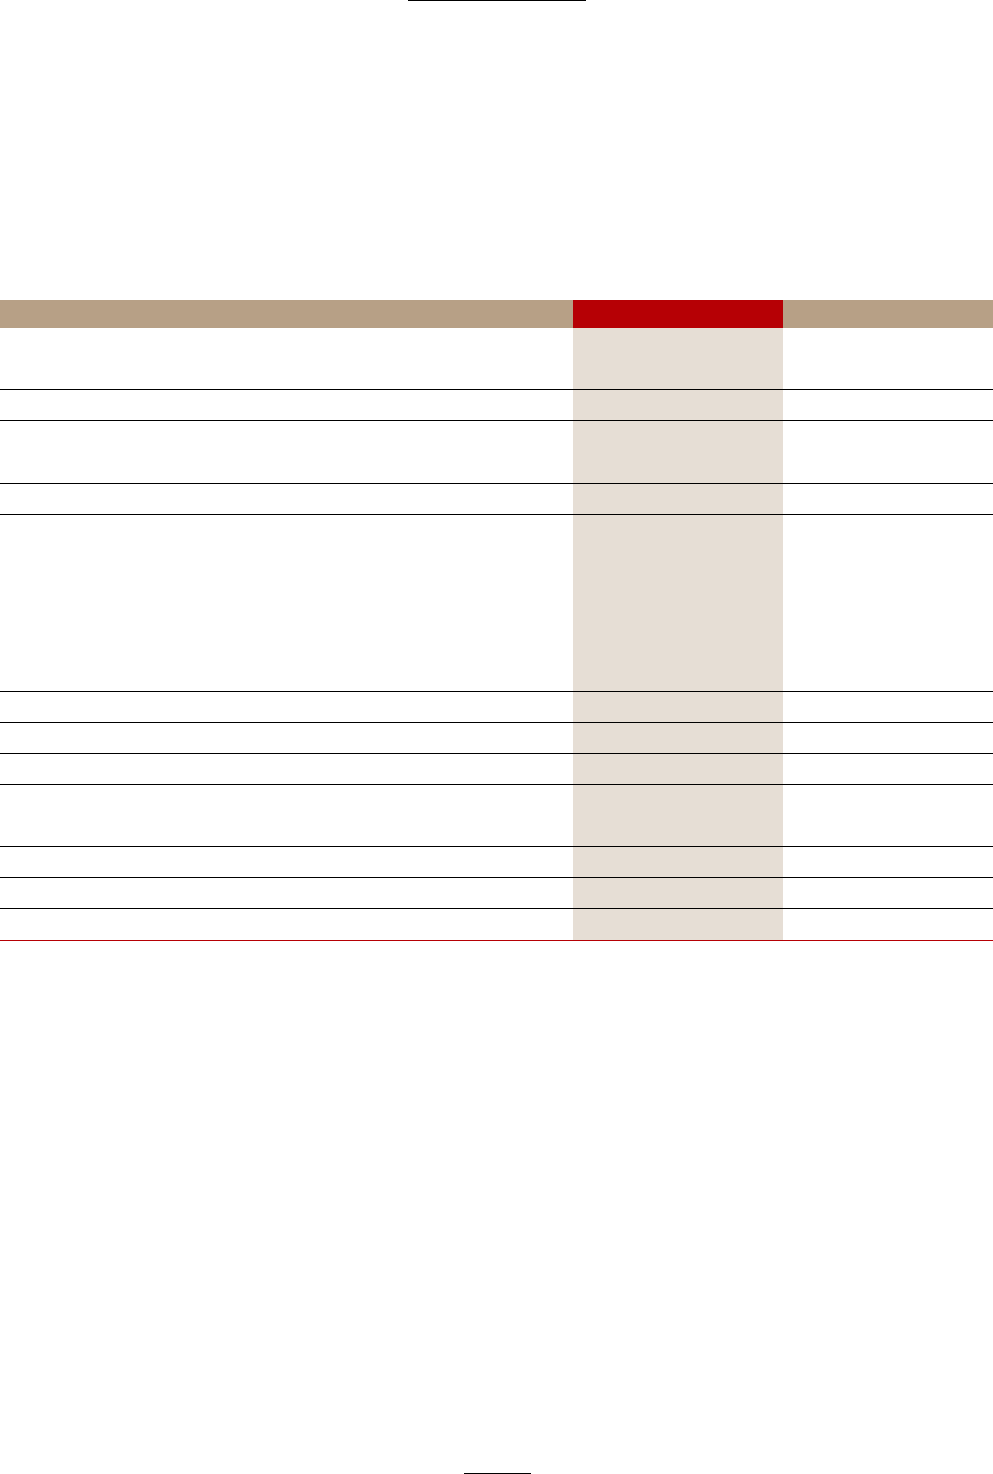
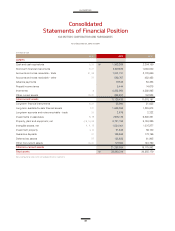
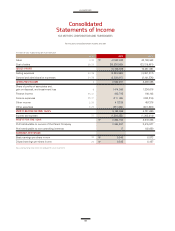
Note 2012 2011
Sales 4, 32 ₩ 47,242,933 43,190,942
Cost of sales 28, 32 (36,536,005) (33,138,961)
10,706,928 10,051,981
Selling expenses 24, 28 (4,845,860) (4,451,317)
General and administrative expenses 24, 28 (2,338,817) (2,101,576)
2 3,522,251 3,499,088
Share of profits of associates and,
gain on disposal, and impairment loss 8 1,414,080 1,336,618
Finance income 25, 31 402,795 180,102
Finance expenses 25, 31 (211,145) (320,216)
Other income 2, 26 417,339 457,378
Other expenses 2, 26 (381,264) (431,320)
5,164,056 4,721,650
Income tax expense 27 (1,299,352) (1,202,414)
₩ 3,864,704 3,519,236
Profit attributable to owners of the Parent Company 3,864,687 3,415,577
Profit attributable to non-controlling interests 17 103,659
Basic earnings per share in won 22 ₩ 9,546 8,573
Diluted earnings per share in won 22 ₩ 9,545 8,457
See accompanying notes to the consolidated financial statements.
(In millions of won, except earnings per share information)
For the years ended December 31, 2012 and 2011