Kia 2012 Annual Report Download - page 102
Download and view the complete annual report
Please find page 102 of the 2012 Kia annual report below. You can navigate through the pages in the report by either clicking on the pages listed below, or by using the keyword search tool below to find specific information within the annual report.-
 1
1 -
2
-
3
-
4
-
5
-
6
-
7
-
8
-
9
-
10
-
11
-
12
-
13
-
14
-
15
-
16
-
17
-
18
-
19
-
20
-
21
-
22
-
23
-
24
-
25
-
26
-
27
-
28
-
29
-
30
-
31
-
32
-
33
-
34
-
35
-
36
-
37
-
38
-
39
-
40
-
41
-
42
-
43
-
44
-
45
-
46
-
47
-
48
-
49
-
50
-
51
-
52
-
53
-
54
-
55
-
56
-
57
-
58
-
59
-
60
-
61
-
62
-
63
-
64
-
65
-
66
-
67
-
68
-
69
-
70
-
71
-
72
-
73
-
74
-
75
-
76
-
77
-
78
-
79
-
80
-
81
-
82
-
83
-
84
-
85
-
86
-
87
-
88
-
89
-
90
-
91
-
 92
92 -
 93
93 -
 94
94 -
 95
95 -
 96
96 -
 97
97 -
 98
98 -
 99
99 -
 100
100 -
 101
101 -
 102
102 -
 103
103 -
 104
104 -
 105
105 -
 106
106 -
 107
107 -
 108
108 -
 109
109 -
 110
110 -
 111
111 -
 112
112 -
113
-
114
 |
 |
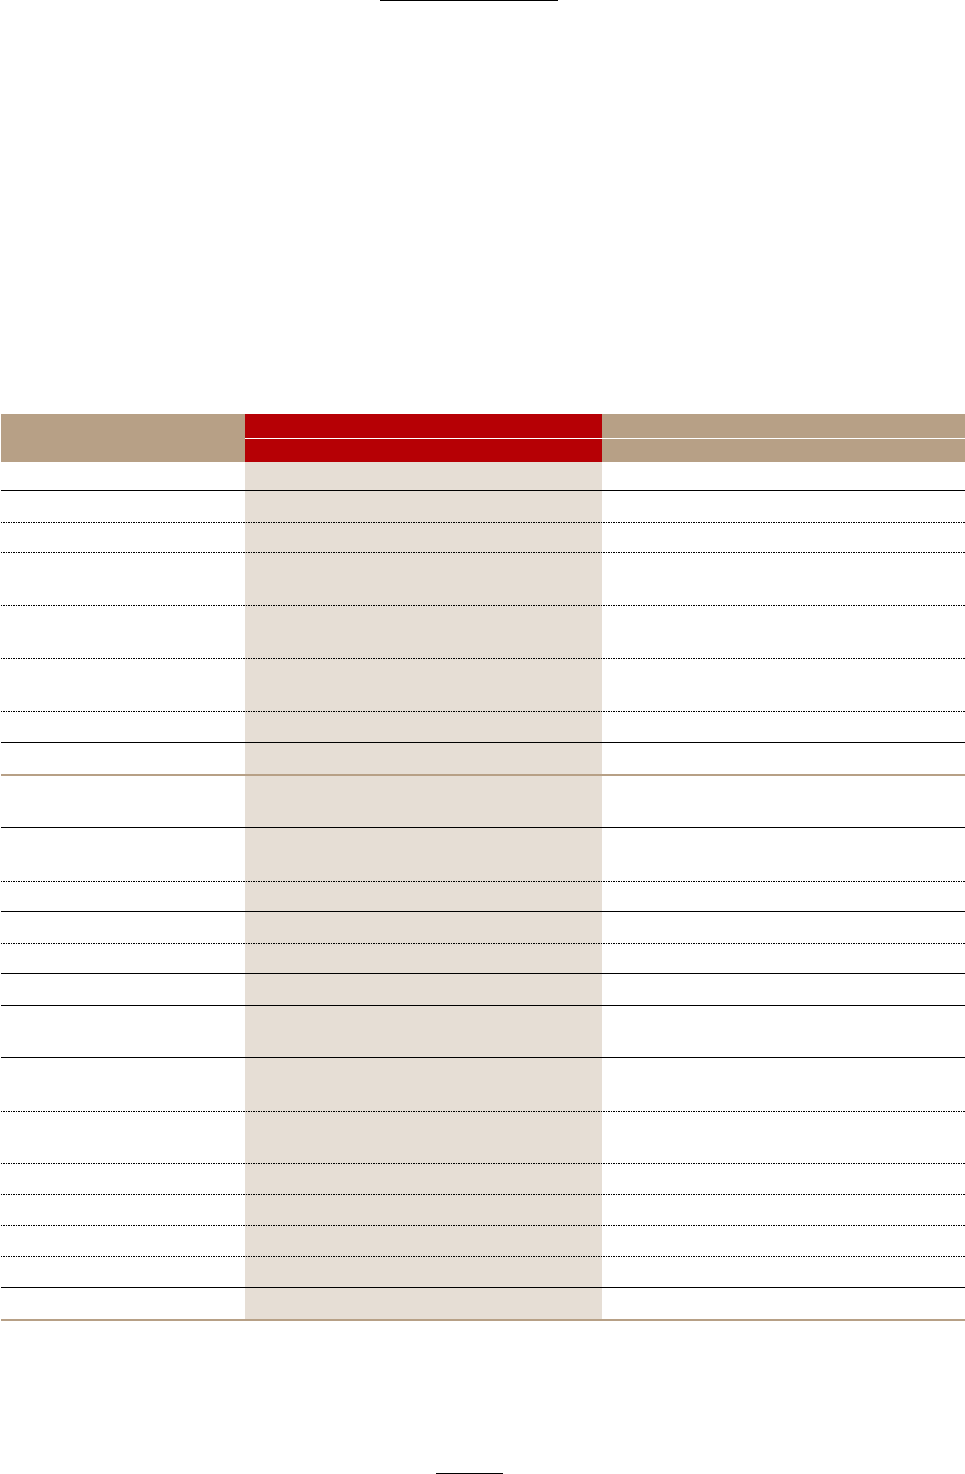
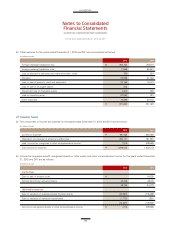
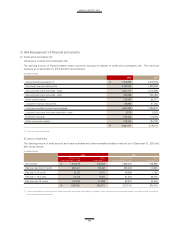
(e) Fair value
(i) Fair value and carrying amount
Details of fair value and carrying amount of financial assets and liabilities by category as of December 31, 2012 and 2011 are
summarized as follows:
(In millions of won)
2012 2011
Carrying amount Fair value Carrying amount Fair value
Cash and cash equivalents ₩ 1,903,309 1,903,309 2,304,169 2,304,169
Short-term financial instruments 2,367,230 2,367,230 1,630,000 1,630,000
Account and notes
receivable - trade 1,801,731 1,801,731 2,178,699 2,178,699
Account and note
receivable - other 485,696 485,696 432,453 432,453
Long-term account and notes
receivable - trade 2,675 2,675 2,322 2,322
Other financial assets 481,724 481,724 389,448 389,448
₩ 7,042,365 7,042,365 6,937,091 6,937,091
Long-term available-for-sale
financial assets ₩ 1,606,358 1,606,358 1,229,673 1,229,673
Held-to-maturity investments ₩ 18,755 18,755 17,380 17,380
Currency option (hedge) ₩ - - 3,520 3,520
Accounts and notes
payable - trade ₩ 4,998,445 4,998,445 4,825,992 4,825,992
Accounts and notes
payable - other 1,713,988 1,713,988 1,744,387 1,744,387
Bonds 1,620,707 1,652,202 2,811,312 2,840,434
Debt 2,233,501 2,228,179 2,767,194 2,735,268
Financial lease liabilities 21,871 21,871 28,795 28,795
Other financial liabilities 1,032,556 1,032,556 822,109 822,109
₩ 11,621,068 11,647,241 12,999,789 12,996,985
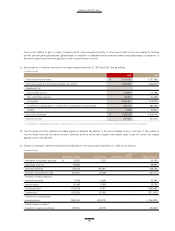
For the years ended December 31, 2012 and 2011