Kia 2012 Annual Report Download - page 84
Download and view the complete annual report
Please find page 84 of the 2012 Kia annual report below. You can navigate through the pages in the report by either clicking on the pages listed below, or by using the keyword search tool below to find specific information within the annual report.-
 1
1 -
2
-
3
-
4
-
5
-
6
-
7
-
8
-
9
-
10
-
11
-
12
-
13
-
14
-
15
-
16
-
17
-
18
-
19
-
20
-
21
-
22
-
23
-
24
-
25
-
26
-
27
-
28
-
29
-
30
-
31
-
32
-
33
-
34
-
35
-
36
-
37
-
38
-
39
-
40
-
41
-
42
-
43
-
44
-
45
-
46
-
47
-
48
-
49
-
50
-
51
-
52
-
53
-
54
-
55
-
56
-
57
-
58
-
59
-
60
-
61
-
62
-
63
-
64
-
65
-
66
-
67
-
68
-
69
-
70
-
71
-
72
-
73
-
 74
74 -
 75
75 -
 76
76 -
 77
77 -
 78
78 -
 79
79 -
 80
80 -
 81
81 -
 82
82 -
 83
83 -
 84
84 -
 85
85 -
 86
86 -
 87
87 -
 88
88 -
 89
89 -
 90
90 -
 91
91 -
 92
92 -
 93
93 -
 94
94 -
95
-
96
-
97
-
98
-
99
-
100
-
101
-
102
-
103
-
104
-
105
-
106
-
107
-
108
-
109
-
110
-
111
-
112
-
113
-
114
 |
 |
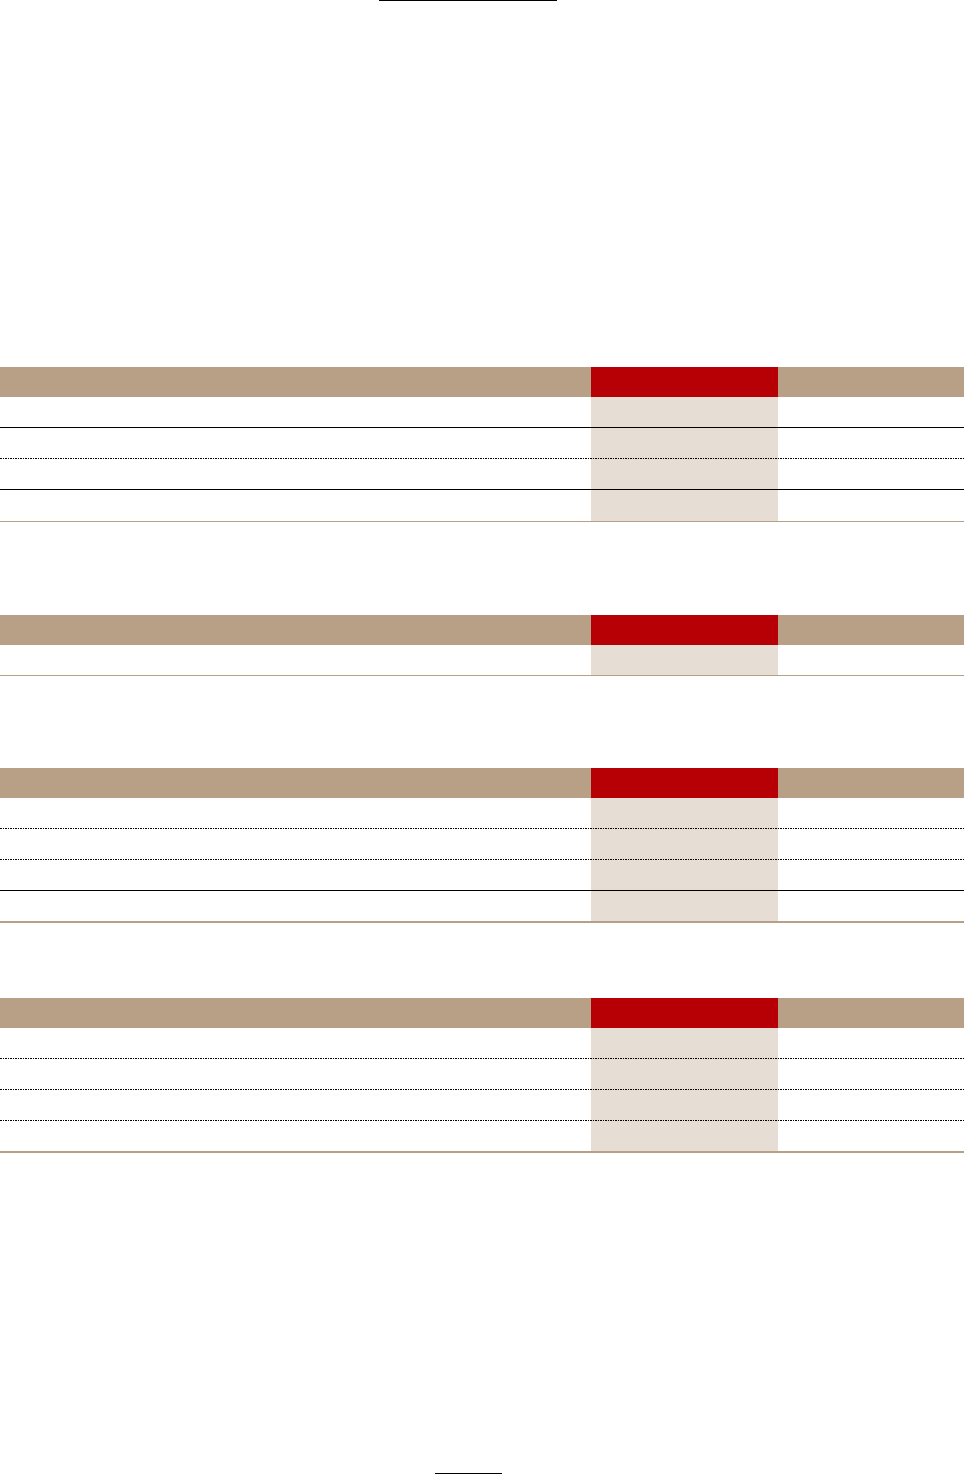
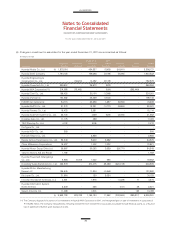
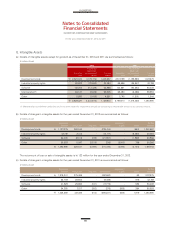
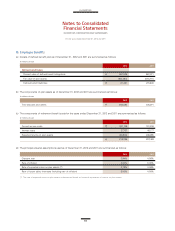
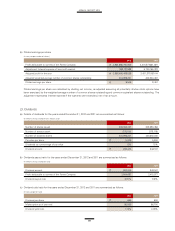
(a) Details of defined benefit plan as of December 31, 2012 and 2011 are summarized as follows:
(b) The components of plan assets as of December 31, 2012 and 2011 are summarized as follows:
(c) The components of retirement benefit costs for the years ended December 31, 2012 and 2011 are summarized as follows:
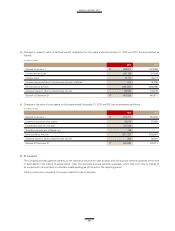
(d) The principal actuarial assumptions used as of December 31, 2012 and 2011 are summarized as follows:
2012 2011
Present value of defined benefit obligations ₩ 961,535 948,871
Fair value of plan assets (940,084) (674,271)
Defined benefit liabilities ₩ 21,451 274,600
2012 2011
Time deposits and others ₩ 940,084 674,271
2012 2011
Current service costs ₩ 201,105 191,916
Interest costs 37,737 48,177
Expected returns on plan assets (26,516) (32,685)
₩ 212,326 207,408
2012 2011
Discount rate 3.94% 4.86%
Rate of inflation 3.00% 3.00%
Rate of expected return on plan assets (*) 3.78% 4.06%
Rate of future salary increases (Including rate of inflation) 5.00% 4.50%
(In millions of won)
(In millions of won)
(In millions of won)
(*) The rate of expected return on plan assets is determined based on historical experience of returns on plan assets.
For the years ended December 31, 2012 and 2011