Kia 2012 Annual Report Download - page 104
Download and view the complete annual report
Please find page 104 of the 2012 Kia annual report below. You can navigate through the pages in the report by either clicking on the pages listed below, or by using the keyword search tool below to find specific information within the annual report.-
 1
1 -
2
-
3
-
4
-
5
-
6
-
7
-
8
-
9
-
10
-
11
-
12
-
13
-
14
-
15
-
16
-
17
-
18
-
19
-
20
-
21
-
22
-
23
-
24
-
25
-
26
-
27
-
28
-
29
-
30
-
31
-
32
-
33
-
34
-
35
-
36
-
37
-
38
-
39
-
40
-
41
-
42
-
43
-
44
-
45
-
46
-
47
-
48
-
49
-
50
-
51
-
52
-
53
-
54
-
55
-
56
-
57
-
58
-
59
-
60
-
61
-
62
-
63
-
64
-
65
-
66
-
67
-
68
-
69
-
70
-
71
-
72
-
73
-
74
-
75
-
76
-
77
-
78
-
79
-
80
-
81
-
82
-
83
-
84
-
85
-
86
-
87
-
88
-
89
-
90
-
91
-
92
-
93
-
 94
94 -
 95
95 -
 96
96 -
 97
97 -
 98
98 -
 99
99 -
 100
100 -
 101
101 -
 102
102 -
 103
103 -
 104
104 -
 105
105 -
 106
106 -
 107
107 -
 108
108 -
 109
109 -
 110
110 -
 111
111 -
 112
112 -
 113
113 -
 114
114
 |
 |

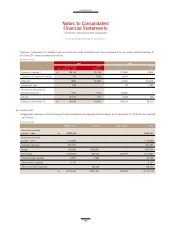
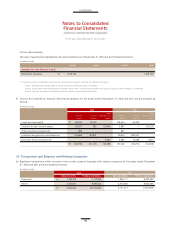
(iii) Fair value hierarchy
Fair value measurement classified by fair value hierarchy as of December 31, 2012 are summarized as follows:
(In millions of won)
(In millions of won)
Marketable securities ₩ 1,218,122 - - 1,218,122
Level 1 Level 2 Level 3 Total
(*) Financial assets and liabilities carried at fair value by each valuation method are defined as follows:
- Level 1: quoted prices (unadjusted) in active markets for identical assets or liabilities
- Level 2: inputs other than quoted prices included within Level 1 that are observable for the asset or liability, either directly or in indirectly
- Level 3: input for the asset or liability that are not based on observable market data
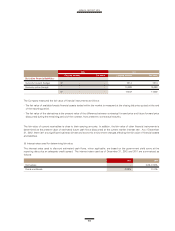
2012 2011
Other Other
Finance Finance comprehensive Finance Finance comprehensive
income expense income income expense income
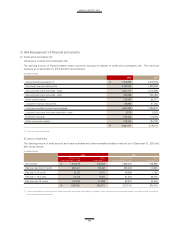
Loans and receivables ₩ 197,688 46,142 - 146,644 49,780 -
Available-for-sale financial assets 64,647 202 127,042 3,597 1 342,338
Held-to-maturity investments 895 - - 831 - -
Liabilities recognized by amortized cost 139,565 164,801 - 25,510 260,347 -
Derivative financia instruments - - 5,543 3,520 10,088 2,507
₩ 402,795 211,145 132,585 180,102 320,216 344,845
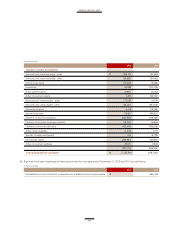
(f) Income and expense by financial instruments category for the years ended December 31, 2012 and 2011 are summarized as
follows:
(a) Significant transactions which occurred in the normal course of business with related companies for the years ended December
31, 2012 and 2011 are summarized as follows:
(In millions of won)
2012 2011
Sales and others Purchase and others Sales and others Purchase and others
Associates ₩ 1,097,815 11,417,266 1,352,171 9,083,582
Others 3,486,801 8,897,832 3,819,206 9,833,936
₩ 4,584,616 20,315,098 5,171,377 18,917,518
For the years ended December 31, 2012 and 2011