Kia 2012 Annual Report Download - page 71
Download and view the complete annual report
Please find page 71 of the 2012 Kia annual report below. You can navigate through the pages in the report by either clicking on the pages listed below, or by using the keyword search tool below to find specific information within the annual report.-
 1
1 -
2
-
3
-
4
-
5
-
6
-
7
-
8
-
9
-
10
-
11
-
12
-
13
-
14
-
15
-
16
-
17
-
18
-
19
-
20
-
21
-
22
-
23
-
24
-
25
-
26
-
27
-
28
-
29
-
30
-
31
-
32
-
33
-
34
-
35
-
36
-
37
-
38
-
39
-
40
-
41
-
42
-
43
-
44
-
45
-
46
-
47
-
48
-
49
-
50
-
51
-
52
-
53
-
54
-
55
-
56
-
57
-
58
-
59
-
60
-
 61
61 -
 62
62 -
 63
63 -
 64
64 -
 65
65 -
 66
66 -
 67
67 -
 68
68 -
 69
69 -
 70
70 -
 71
71 -
 72
72 -
 73
73 -
 74
74 -
 75
75 -
 76
76 -
 77
77 -
 78
78 -
 79
79 -
 80
80 -
 81
81 -
82
-
83
-
84
-
85
-
86
-
87
-
88
-
89
-
90
-
91
-
92
-
93
-
94
-
95
-
96
-
97
-
98
-
99
-
100
-
101
-
102
-
103
-
104
-
105
-
106
-
107
-
108
-
109
-
110
-
111
-
112
-
113
-
114
 |
 |
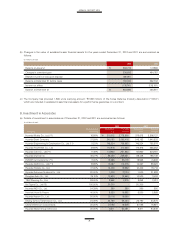
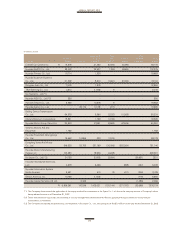
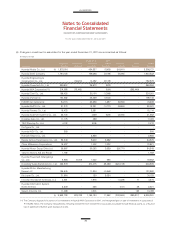
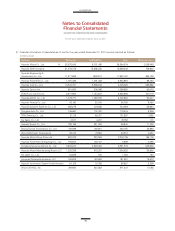
(a) Details of investment in associates as of December 31, 2012 and 2011 are summarized as follows:
(In millions of won)
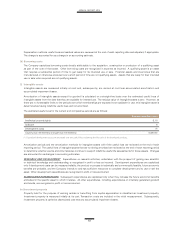
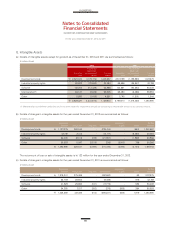
(b) Changes in fair value of available-for-sale financial assets for the years ended December 31, 2012 and 2011 are summarized as
follows:
(c) The Company has provided 1,500 units (carrying amount: ₩ 569 million) of the Korea Defense Industry Association (“KDIA”),
which are included in available-for-sale financial assets for a performance guarantee on a contract.
2012 2011
Balance at January 1 ₩ 562,732 107,965
Changes in unrealized gain 236,683 454,767
Realized in profit or loss upon disposal (69,081) -
Balance at December 31 before taxes 730,334 562,732
Income tax effect (176,741) (136,181)
Balance at December 31 ₩ 553,593 426,551
(In millions of won)
2012 2011
Percentage of Acquisition Carrying Acquisition Carrying
Company ownership cost amount cost amount
Hyundai Mobis Co., Ltd.(*1) 16.88% ₩ 215,012 2,775,505 215,012 2,286,137
Hyundai Steel Company 21.29% 245,153 2,092,416 245,153 1,940,532
Hyundai Engineering & Construction Co., Ltd.(*1) 5.23% 746,234 755,953 746,234 752,578
Hyundai Powertech Co., Ltd. 37.58% 172,576 310,230 172,576 266,352
Hyundai Card Co., Ltd.(*1) 11.48% 147,960 251,943 147,960 224,501
Hyundai Dymos Inc. 45.37% 89,438 225,631 89,438 188,148
EUKOR Car Carriers Inc.(*1) 8.00% 19,565 85,178 19,565 74,208
Hyundai AMCO Co., Ltd.(*1) 19.99% 10,067 112,375 10,067 88,023
Hyundai Partecs Co., Ltd. 31.00% 12,400 19,952 12,400 18,714
Hyundai Autoever Systems Co., Ltd. 20.00% 1,000 37,134 1,000 31,582
Donghee Auto Co., Ltd. 35.10% 10,530 12,950 10,530 11,674
TRW Steering Co., Ltd. 29.00% 8,952 2,215 8,952 3,213
Kia Tigers Co., Ltd(*2) 100.00% 20,300 - 20,300 -
Hyundai NGV Co., Ltd. 24.39% 250 250 250 250
Haevichi Hotel & Resort 40.00% 8,520 19,852 8,520 2,868
Hyundai Autron Co., Ltd. 20.00% 20,116 18,690 - -
Beijing Dymos Transmission Co., Ltd. 24.08% 22,790 58,334 22,790 64,575
China Millennium Corporations 30.30% 27,185 19,505 27,185 18,921
Hyundai Motor Group China Ltd. 30.00% 9,211 60,391 9,211 84,248