Kia 2012 Annual Report Download - page 72
Download and view the complete annual report
Please find page 72 of the 2012 Kia annual report below. You can navigate through the pages in the report by either clicking on the pages listed below, or by using the keyword search tool below to find specific information within the annual report.-
 1
1 -
2
-
3
-
4
-
5
-
6
-
7
-
8
-
9
-
10
-
11
-
12
-
13
-
14
-
15
-
16
-
17
-
18
-
19
-
20
-
21
-
22
-
23
-
24
-
25
-
26
-
27
-
28
-
29
-
30
-
31
-
32
-
33
-
34
-
35
-
36
-
37
-
38
-
39
-
40
-
41
-
42
-
43
-
44
-
45
-
46
-
47
-
48
-
49
-
50
-
51
-
52
-
53
-
54
-
55
-
56
-
57
-
58
-
59
-
60
-
61
-
 62
62 -
 63
63 -
 64
64 -
 65
65 -
 66
66 -
 67
67 -
 68
68 -
 69
69 -
 70
70 -
 71
71 -
 72
72 -
 73
73 -
 74
74 -
 75
75 -
 76
76 -
 77
77 -
 78
78 -
 79
79 -
 80
80 -
 81
81 -
 82
82 -
83
-
84
-
85
-
86
-
87
-
88
-
89
-
90
-
91
-
92
-
93
-
94
-
95
-
96
-
97
-
98
-
99
-
100
-
101
-
102
-
103
-
104
-
105
-
106
-
107
-
108
-
109
-
110
-
111
-
112
-
113
-
114
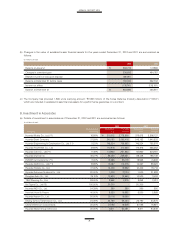
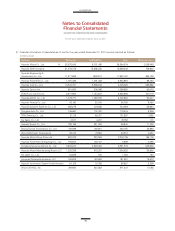
 |
 |

(In millions of won)
(*1) Though the Company’s ownership is below 20%, the Company has significant influence on the financial and operating policy decisions.
(*2) Though the Company has 100% of the ownership, applied equity method because management believes that difference between consolidation and
applying equity method is immaterial.
(*3) Dongfeng Yueda Kia motors Co., Ltd. And Hyundai Capital Services UK Ltd. are jointly controlled entities established by contractual agreement.
(b) Fair value of marketable securities of associates companies as of December 31, 2012 and 2011 are summarized as follows:
2012 2011
Hyundai Mobis Co., Ltd. ₩ 4,730,997 4,796,706
Hyundai Steel Company 1,594,406 1,737,866
Hyundai Engineering & Construction Co., Ltd. ₩ 408,230 410,562
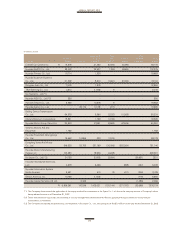
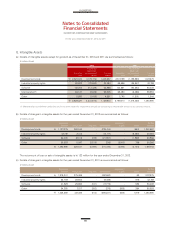
(In millions of won)
2012 2011
Percentage of Acquisition Carrying Acquisition Carrying
Company ownership cost amount cost amount
Yanji Kia Motors A/S and Repair(*2) 100.00% ₩ 1,792 1,792 1,792 1,792
Hyundai Powertech (Shangdong) Co., Ltd. 25.00% 28,894 29,179 17,935 19,552
Dongfeng Yueda Kia Motors Co., Ltd.(*3) 50.00% 274,134 751,146 161,372 546,535
Hyundai Motor Manufacturing Russia LLC 30.00% 129,229 208,581 129,229 133,293
Kia Japan Co., Ltd.(*2) 100.00% 33,197 7,831 33,197 34,128
Innocean Worldwide Americas, LLC 30.00% 557 5,619 557 4,278
Hyundai Information System North America 30.00% 1,911 2,476 1,911 2,521
Sewon America, Inc. 40.00% 15,090 8,985 15,090 10,768
Hyundai Capital Services UK Ltd(*3). 10.00% 3,462 2,066 - -
₩ 2,275,525 7,876,179 2,128,226 6,809,391
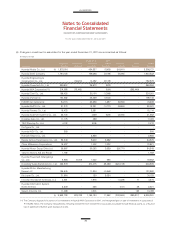
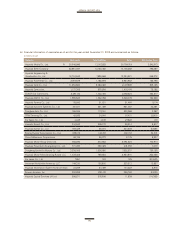
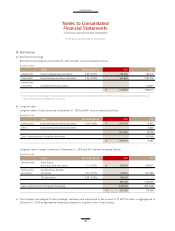
(c) Changes in investment in associates for the year ended December 31, 2012 are summarized as follows:
(In millions of won)
Equity profit Other Other
Beginning or loss on capital Dividends Increase Ending
Company balance Acquisition investment movement received (decrease) balance
Hyundai Mobis Co., Ltd. ₩ 2,286,137 - 562,022 (43,907) (28,747) - 2,775,505
Hyundai Steel Company 1,940,532 - 169,888 (8,924) (9,080) - 2,092,416
Hyundai Engineering &
Construction Co., Ltd. 752,578 - 11,696 (5,405) (2,916) - 755,953
Hyundai Powertech Co., Ltd. 266,352 - 46,538 (2,660) - - 310,230
Hyundai Card Co., Ltd. 224,501 - 27,291 151 - - 251,943
Hyundai Dymos Inc. 188,148 - 40,359 (2,876) - - 225,631
For the years ended December 31, 2012 and 2011