Kia 2012 Annual Report Download - page 69
Download and view the complete annual report
Please find page 69 of the 2012 Kia annual report below. You can navigate through the pages in the report by either clicking on the pages listed below, or by using the keyword search tool below to find specific information within the annual report.-
 1
1 -
2
-
3
-
4
-
5
-
6
-
7
-
8
-
9
-
10
-
11
-
12
-
13
-
14
-
15
-
16
-
17
-
18
-
19
-
20
-
21
-
22
-
23
-
24
-
25
-
26
-
27
-
28
-
29
-
30
-
31
-
32
-
33
-
34
-
35
-
36
-
37
-
38
-
39
-
40
-
41
-
42
-
43
-
44
-
45
-
46
-
47
-
48
-
49
-
50
-
51
-
52
-
53
-
54
-
55
-
56
-
57
-
58
-
 59
59 -
 60
60 -
 61
61 -
 62
62 -
 63
63 -
 64
64 -
 65
65 -
 66
66 -
 67
67 -
 68
68 -
 69
69 -
 70
70 -
 71
71 -
 72
72 -
 73
73 -
 74
74 -
 75
75 -
 76
76 -
 77
77 -
 78
78 -
 79
79 -
80
-
81
-
82
-
83
-
84
-
85
-
86
-
87
-
88
-
89
-
90
-
91
-
92
-
93
-
94
-
95
-
96
-
97
-
98
-
99
-
100
-
101
-
102
-
103
-
104
-
105
-
106
-
107
-
108
-
109
-
110
-
111
-
112
-
113
-
114
 |
 |
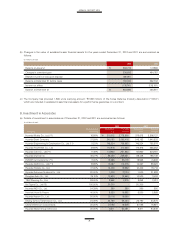
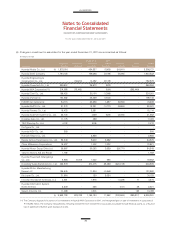
The Company is engaged in manufacturing and sales of vehicles and parts, leasing of vehicles and rendering vehicle maintenance
services. Leasing income and maintenance services are insignificant to total sales. Revenue information for each product and
service is not available and management believes the cost to develop such information would be excessive. Consequently revenue
amounts for each product and service is not disclosed.
(a) The following tables provide information of sales by region based on the location of customers and non-current assets as of and for
the year ended December 31, 2012:
(In millions of won)
North Other Consolidation Consolidation
Domestic America Europe region adjustment amount
Net sales ₩ 17,734,873 16,799,524 11,797,175 911,361 - 47,242,933
Property, plant and equipment,
intangible asset and other 8,745,685 1,297,834 1,214,199 6,362 32,553 11,296,633
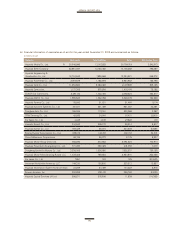
(b) The following tables provide information of sales by geographic locations based on the location of customers and non-current
assets as of and for the year ended December 31, 2011:
(In millions of won)
North Other Consolidation Consolidation
Domestic America Europe region adjustment amount
Net sales ₩ 17,678,511 13,754,969 11,026,858 730,604 - 43,190,942
Property, plant and equipment,
intangible asset and other 8,170,218 1,337,992 1,211,511 5,604 32,437 10,757,762
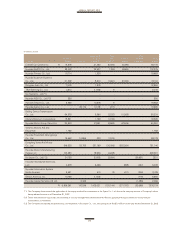
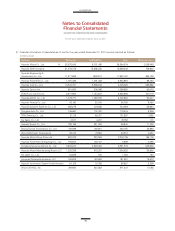
(b) Financial instruments which are restricted in use for as of December 31, 2012 and 2011 are summarized as follows:
(a) Cash and cash equivalents as of December 31, 2012 and 2011 are summarized as follows:
2012 2011
Cash on hand ₩ 321 350
Deposits with financial institutions 1,902,988 2,303,819
₩ 1,903,309 2,304,169
2012 2011
Win-Win cooperation deposits ₩ 27,000 16,000
Guarantee deposits 13 13
Green mold fund 20,000 -
Other deposits 3,384 18,899
₩ 50,397 34,912
(In millions of won)
(In millions of won)