Kia 2012 Annual Report Download - page 70
Download and view the complete annual report
Please find page 70 of the 2012 Kia annual report below. You can navigate through the pages in the report by either clicking on the pages listed below, or by using the keyword search tool below to find specific information within the annual report.-
 1
1 -
2
-
3
-
4
-
5
-
6
-
7
-
8
-
9
-
10
-
11
-
12
-
13
-
14
-
15
-
16
-
17
-
18
-
19
-
20
-
21
-
22
-
23
-
24
-
25
-
26
-
27
-
28
-
29
-
30
-
31
-
32
-
33
-
34
-
35
-
36
-
37
-
38
-
39
-
40
-
41
-
42
-
43
-
44
-
45
-
46
-
47
-
48
-
49
-
50
-
51
-
52
-
53
-
54
-
55
-
56
-
57
-
58
-
59
-
 60
60 -
 61
61 -
 62
62 -
 63
63 -
 64
64 -
 65
65 -
 66
66 -
 67
67 -
 68
68 -
 69
69 -
 70
70 -
 71
71 -
 72
72 -
 73
73 -
 74
74 -
 75
75 -
 76
76 -
 77
77 -
 78
78 -
 79
79 -
 80
80 -
81
-
82
-
83
-
84
-
85
-
86
-
87
-
88
-
89
-
90
-
91
-
92
-
93
-
94
-
95
-
96
-
97
-
98
-
99
-
100
-
101
-
102
-
103
-
104
-
105
-
106
-
107
-
108
-
109
-
110
-
111
-
112
-
113
-
114
 |
 |
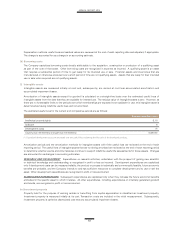
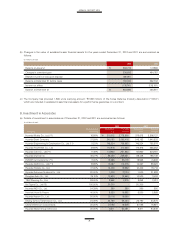
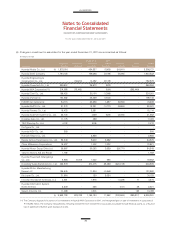
Inventories as of December 31, 2012 and 2011 are summarized as follows:
2012 2011
Finished goods ₩ 2,744,556 2,912,829
Merchandise 190,924 176,226
Semi-finished goods 468,067 430,417
Work-in-process 161,086 165,939
Raw materials 441,756 446,756
Supplies 105,165 89,938
Materials-in-transit 111,396 80,760
₩ 4,222,950 4,302,865
(In millions of won)
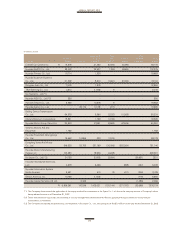
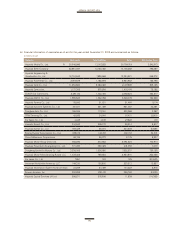
(a) Long-term available-for-sales financial assets as of December 31, 2012 and 2011 are summarized as follows:
(In millions of won)
Hyundai WIA Corporation 14.20% ₩ 237,510 632,143 647,716
Hyundai Hysco Co., Ltd. 15.65% 224,319 570,610 392,087
HMC Investment Securities Co., Ltd. 3.68% 25,939 15,319 13,809
SeAH Besteel Corp. 0.00% 20 50 80
487,788 1,218,122 1,053,692
WIA Automotive Engine
(Shang-dong) Company 18.00% 47,332 47,332 35,382
Hyundai Capital America 15.00% 321,330 321,330 115,330
Other 19,574 19,574 25,269
388,236 388,236 175,981
₩ 876,024 1,606,358 1,229,673
Company Percentage of ownership Acquisition Cost 2012 2011
(*) Investments in equity instruments that do not have a quoted market price in an active market, and whose fair value cannot be reliably measured are
measured at cost.
For the years ended December 31, 2012 and 2011