Honeywell 2006 Annual Report Download - page 95
Download and view the complete annual report
Please find page 95 of the 2006 Honeywell annual report below. You can navigate through the pages in the report by either clicking on the pages listed below, or by using the keyword search tool below to find specific information within the annual report.-
 1
1 -
2
-
3
-
4
-
5
-
6
-
7
-
8
-
9
-
10
-
11
-
12
-
13
-
14
-
15
-
16
-
17
-
18
-
19
-
20
-
21
-
22
-
23
-
24
-
25
-
26
-
27
-
28
-
29
-
30
-
31
-
32
-
33
-
34
-
35
-
36
-
37
-
38
-
39
-
40
-
41
-
42
-
43
-
44
-
45
-
46
-
47
-
48
-
49
-
50
-
51
-
52
-
53
-
54
-
55
-
56
-
57
-
58
-
59
-
60
-
61
-
62
-
63
-
64
-
65
-
66
-
67
-
68
-
69
-
70
-
71
-
72
-
73
-
74
-
75
-
76
-
77
-
78
-
79
-
80
-
81
-
82
-
83
-
84
-
 85
85 -
 86
86 -
 87
87 -
 88
88 -
 89
89 -
 90
90 -
 91
91 -
 92
92 -
 93
93 -
 94
94 -
 95
95 -
 96
96 -
 97
97 -
 98
98 -
 99
99 -
 100
100 -
 101
101 -
 102
102 -
 103
103 -
 104
104 -
 105
105 -
106
-
107
-
108
-
109
-
110
-
111
-
112
-
113
-
114
-
115
-
116
-
117
-
118
-
119
-
120
-
121
-
122
-
123
-
124
-
125
-
126
-
127
-
128
-
129
-
130
-
131
-
132
-
133
-
134
-
135
-
136
-
137
-
138
-
139
-
140
-
141
-
142
-
143
-
144
-
145
-
146
-
147
-
148
-
149
-
150
-
151
-
152
-
153
-
154
-
155
-
156
-
157
-
158
-
159
-
160
-
161
-
162
-
163
-
164
-
165
-
166
-
167
-
168
-
169
-
170
-
171
-
172
-
173
-
174
-
175
-
176
-
177
-
178
-
179
-
180
-
181
-
182
-
183
-
184
-
185
-
186
-
187
-
188
-
189
-
190
-
191
-
192
-
193
-
194
-
195
-
196
-
197
-
198
-
199
-
200
-
201
-
202
-
203
-
204
-
205
-
206
-
207
-
208
-
209
-
210
-
211
-
212
-
213
-
214
-
215
-
216
-
217
 |
 |

HONEYWELL INTERNATIONAL INC.
NOTES TO FINANCIAL STATEMENTS—(Continued)
(Dollars in millions, except per share amounts)
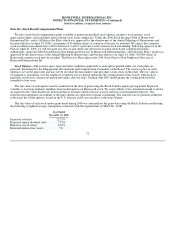
the British pound, the Canadian dollar, the Hong Kong dollar, the Chinese renminbi, and the Singapore dollar.
We hedge monetary assets and liabilities denominated in non-functional currencies. Prior to conversion into U.S dollars, these
assets and liabilities are remeasured at spot exchange rates in effect on the balance sheet date. The effects of changes in spot rates are
recognized in earnings and included in Other/(Income) Expense. We hedge our exposure to changes in foreign exchange rates
principally with forward contracts. Forward contracts are marked-to-market with the resulting gains and losses similarly recognized in
earnings offsetting the gains and losses on the non-functional currency denominated monetary assets and liabilities being hedged.
We partially hedge forecasted 2007 sales and purchases denominated in non-functional currencies with currency forward
contracts. When a functional currency strengthens against non-functional currencies, the decline in value of forecasted non-functional
currency cash inflows (sales) or outflows (purchases) is partially offset by the recognition of gains (sales) and losses (purchases),
respectively, in the value of the forward contracts designated as hedges. Conversely, when a functional currency weakens against non-
functional currencies, the increase in value of forecasted non-functional currency cash inflows (sales) or outflows (purchases) is
partially offset by the recognition of losses (sales) and gains (purchases), respectively, in the value of the forward contracts designated
as hedges. Market value gains and losses on these contracts are recognized in earnings when the hedged transaction is recognized. All
open forward contracts mature by December 31, 2007.
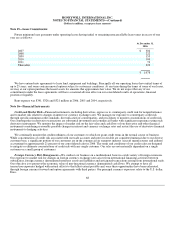
At December 31, 2006 and 2005, we had contracts with notional amounts of $2,572 and $1,998 million, respectively, to exchange
foreign currencies, principally in the Euro countries and Great Britain.
Commodity Price Risk Management—Our exposure to market risk for commodity prices can result in changes in our cost of
production. We primarily mitigate our exposure to commodity price risk through the use of long-term, fixed-price contracts with our
suppliers and formula price agreements with suppliers and customers. We also enter into forward commodity purchase agreements
with third parties designated as hedges of anticipated purchases of several commodities. Forward commodity purchase agreements are
marked-to-market, with the resulting gains and losses recognized in earnings when the hedged transaction is recognized.
Interest Rate Risk Management—We use a combination of financial instruments, including long-term, medium-term and short-
term financing, variable-rate commercial paper, and interest rate swaps to manage the interest rate mix of our total debt portfolio and
related overall cost of borrowing. At December 31, 2006 and 2005, interest rate swap agreements designated as fair value hedges
effectively changed $700 and $681 million, respectively, of fixed rate debt at an average rate of 6.38 and 6.15 percent, respectively, to
LIBOR based floating rate debt. Our interest rate swaps mature through 2028.
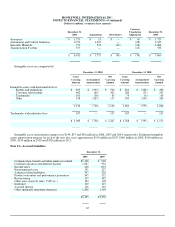
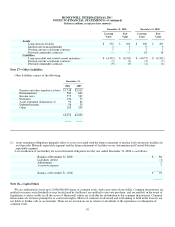
Fair Value of Financial Instruments—The carrying value of cash and cash equivalents, trade accounts and notes receivables,
payables, commercial paper and short-term borrowings contained in the Consolidated Balance Sheet approximates fair value.
Summarized below are the carrying values and fair values of our other financial instruments at December 31, 2006 and 2005. The fair
values are based on the quoted market prices for the issues (if traded), current rates offered to us for debt of the same remaining
maturity and characteristics, or other valuation techniques, as appropriate.
69