Honeywell 2006 Annual Report Download - page 84
Download and view the complete annual report
Please find page 84 of the 2006 Honeywell annual report below. You can navigate through the pages in the report by either clicking on the pages listed below, or by using the keyword search tool below to find specific information within the annual report.-
 1
1 -
2
-
3
-
4
-
5
-
6
-
7
-
8
-
9
-
10
-
11
-
12
-
13
-
14
-
15
-
16
-
17
-
18
-
19
-
20
-
21
-
22
-
23
-
24
-
25
-
26
-
27
-
28
-
29
-
30
-
31
-
32
-
33
-
34
-
35
-
36
-
37
-
38
-
39
-
40
-
41
-
42
-
43
-
44
-
45
-
46
-
47
-
48
-
49
-
50
-
51
-
52
-
53
-
54
-
55
-
56
-
57
-
58
-
59
-
60
-
61
-
62
-
63
-
64
-
65
-
66
-
67
-
68
-
69
-
70
-
71
-
72
-
73
-
 74
74 -
 75
75 -
 76
76 -
 77
77 -
 78
78 -
 79
79 -
 80
80 -
 81
81 -
 82
82 -
 83
83 -
 84
84 -
 85
85 -
 86
86 -
 87
87 -
 88
88 -
 89
89 -
 90
90 -
 91
91 -
 92
92 -
 93
93 -
 94
94 -
95
-
96
-
97
-
98
-
99
-
100
-
101
-
102
-
103
-
104
-
105
-
106
-
107
-
108
-
109
-
110
-
111
-
112
-
113
-
114
-
115
-
116
-
117
-
118
-
119
-
120
-
121
-
122
-
123
-
124
-
125
-
126
-
127
-
128
-
129
-
130
-
131
-
132
-
133
-
134
-
135
-
136
-
137
-
138
-
139
-
140
-
141
-
142
-
143
-
144
-
145
-
146
-
147
-
148
-
149
-
150
-
151
-
152
-
153
-
154
-
155
-
156
-
157
-
158
-
159
-
160
-
161
-
162
-
163
-
164
-
165
-
166
-
167
-
168
-
169
-
170
-
171
-
172
-
173
-
174
-
175
-
176
-
177
-
178
-
179
-
180
-
181
-
182
-
183
-
184
-
185
-
186
-
187
-
188
-
189
-
190
-
191
-
192
-
193
-
194
-
195
-
196
-
197
-
198
-
199
-
200
-
201
-
202
-
203
-
204
-
205
-
206
-
207
-
208
-
209
-
210
-
211
-
212
-
213
-
214
-
215
-
216
-
217
 |
 |

HONEYWELL INTERNATIONAL INC.
NOTES TO FINANCIAL STATEMENTS—(Continued)
(Dollars in millions, except per share amounts)
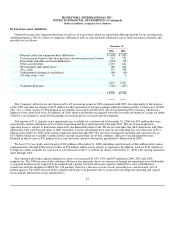
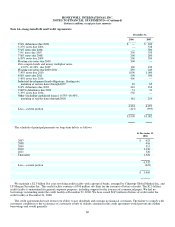
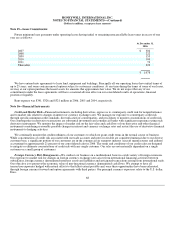
Deferred tax assets (liabilities)
Deferred income taxes represent the future tax effects of transactions which are reported in different periods for tax and financial
reporting purposes. The tax effects of temporary differences and tax carryforwards which give rise to future income tax benefits and
payables are as follows:
December 31,
2006 2005
Property, plant and equipment basis differences $ (608) $ (582)
Postretirement benefits other than pensions and postemployment benefits 747 771
Investment and other asset basis differences (396) (31)
Other accrued items 1,567 642
Net operating and capital losses 786 841
Tax credits 315 408
Undistributed earnings of subsidiaries (40) (40)
All other items—net 43 8
2,414 2,017
Valuation allowance (516) (477)
$1,898 $1,540
The Company's effective tax rate decreased by 6.2 percentage points in 2006 compared with 2005, due principally to the absence
of the 2005 one-time tax charge of $155 million for the repatriation of foreign earnings under the American Jobs Creation Act of 2004
(the “Act”), offset, in part, by $64 million of tax benefits associated with the 2005 sale of our Industrial Wax business which had a
higher tax basis than book basis. In addition, in 2006, there were benefits recognized from the favorable resolution of certain tax audits
offset by a tax charge for an up-front licensing of certain in-process research and development.
The amount of U.S. federal tax net operating losses available for carryforward at December 31, 2006 was $35 million that were
generated by certain subsidiaries prior to their acquisition and have expiration dates through 2024. The use of pre-acquisition
operating losses is subject to limitations imposed by the Internal Revenue Code. We do not anticipate that these limitations will affect
utilization of the carryforwards prior to their expiration. Various subsidiaries have state tax net operating loss carryforwards of $3.2
billion at December 31, 2006 with varying expiration dates through 2025. We also have foreign net operating and capital losses of
$2.4 billion which are available to reduce future income tax payments in several countries, subject to varying expiration rules.
Included in these losses is $32 million of loss carryforwards related to businesses purchased by Honeywell in 2006.
We have U.S. tax credit carryforwards of $94 million at December 31, 2006, including carryforwards of $41 million with various
expiration dates through 2026 and tax credits of $53 million which are not subject to expiration. In addition, we have $221 million of
foreign tax credits available for carryback or carryforward on the U.S. federal tax return at December 31, 2006 with varying expiration
dates through 2015.
The valuation allowance against deferred tax assets was increased by $39, $139 and $39 million in 2006, 2005 and 2004,
respectively. The 2006 increase in the valuation allowance was primarily due to an increase in foreign net operating losses attributable
to acquired businesses not expected to be realized and a partial valuation allowance against a deferred tax asset established in
connection with the adoption of SFAS No. 158 partially offset by a decrease in state tax net operating loss carryforwards (net of
federal impact). The 2005 increase in the valuation allowance was primarily due to an increase in foreign net operating and capital
losses and net deferred tax assets attributable to
61