Honeywell 2006 Annual Report Download - page 42
Download and view the complete annual report
Please find page 42 of the 2006 Honeywell annual report below. You can navigate through the pages in the report by either clicking on the pages listed below, or by using the keyword search tool below to find specific information within the annual report.-
 1
1 -
2
-
3
-
4
-
5
-
6
-
7
-
8
-
9
-
10
-
11
-
12
-
13
-
14
-
15
-
16
-
17
-
18
-
19
-
20
-
21
-
22
-
23
-
24
-
25
-
26
-
27
-
28
-
29
-
30
-
31
-
 32
32 -
 33
33 -
 34
34 -
 35
35 -
 36
36 -
 37
37 -
 38
38 -
 39
39 -
 40
40 -
 41
41 -
 42
42 -
 43
43 -
 44
44 -
 45
45 -
 46
46 -
 47
47 -
 48
48 -
 49
49 -
 50
50 -
 51
51 -
 52
52 -
53
-
54
-
55
-
56
-
57
-
58
-
59
-
60
-
61
-
62
-
63
-
64
-
65
-
66
-
67
-
68
-
69
-
70
-
71
-
72
-
73
-
74
-
75
-
76
-
77
-
78
-
79
-
80
-
81
-
82
-
83
-
84
-
85
-
86
-
87
-
88
-
89
-
90
-
91
-
92
-
93
-
94
-
95
-
96
-
97
-
98
-
99
-
100
-
101
-
102
-
103
-
104
-
105
-
106
-
107
-
108
-
109
-
110
-
111
-
112
-
113
-
114
-
115
-
116
-
117
-
118
-
119
-
120
-
121
-
122
-
123
-
124
-
125
-
126
-
127
-
128
-
129
-
130
-
131
-
132
-
133
-
134
-
135
-
136
-
137
-
138
-
139
-
140
-
141
-
142
-
143
-
144
-
145
-
146
-
147
-
148
-
149
-
150
-
151
-
152
-
153
-
154
-
155
-
156
-
157
-
158
-
159
-
160
-
161
-
162
-
163
-
164
-
165
-
166
-
167
-
168
-
169
-
170
-
171
-
172
-
173
-
174
-
175
-
176
-
177
-
178
-
179
-
180
-
181
-
182
-
183
-
184
-
185
-
186
-
187
-
188
-
189
-
190
-
191
-
192
-
193
-
194
-
195
-
196
-
197
-
198
-
199
-
200
-
201
-
202
-
203
-
204
-
205
-
206
-
207
-
208
-
209
-
210
-
211
-
212
-
213
-
214
-
215
-
216
-
217
 |
 |

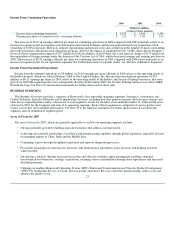
2007 Areas of Focus
Specialty Materials primary areas of focus for 2007 include:
• Increasing resources and market penetration in Asia;
• Developing new products that address energy efficiency, global warming and security regulations;
• Increasing product differentiation in order to continue to expand margins; and
• Continued contract wins in the petrochemical and refining industries.
Transportation Systems
Overview
Transportation Systems provides automotive products that improve the performance, efficiency, and appearance of cars, trucks,
and other vehicles through state-of-the-art technologies, world class brands and global solutions to customers needs. Transportation
Systems' products include Garrett(R) turbochargers and charge-air and thermal systems; car care products including anti-freeze
(Prestone(R)), filters (Fram(R)), spark plugs (Autolite(R)), and cleaners, waxes and additives (Holts(R)); and brake hard parts and
other friction materials (Bendix(R) and Jurid(R)). Transportation Systems sells its products to OE automotive and truck manufacturers
(e.g., BMW, Caterpillar, Daimler-Chrysler, Ford, and Volkswagen), wholesalers and distributors and through the retail aftermarket.
Economic and Other Factors
Transportation Systems operating results are principally driven by:
• Global demand for automobile and truck production;
• Diesel penetration rates for new platforms;
• Global consumer preferences for diesel passenger cars;
• Demand for North American truck production in conjunction with new lower emission regulations;
• The degree of volatility in raw material prices including nickel and steel; and
• Changes in consumer spending for automotive aftermarket and car care products.
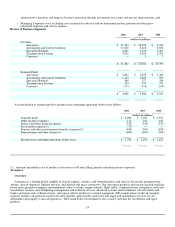
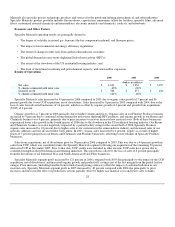
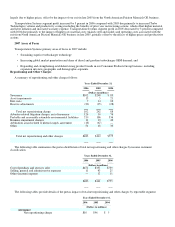
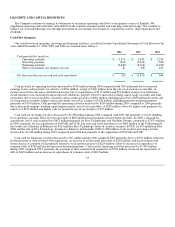
Results of Operations
2006 2005 2004
(Dollars in millions)
Net sales $ 4,592 $ 4,505 $ 4,323
% change compared with prior year 2% 4%
Segment profit $ 574 $ 557 $ 575
% change compared with prior year 3% (3)%
Transportation Systems sales increased 2 percent in 2006 compared with 2005, primarily due to increased sales in our Turbo
Technologies business, offset by lower sales in our Consumer Products Group. In 2005, sales increased by 4 percent compared with
2004 due primarily to favorable sales mix of 2 percent, the favorable effect of foreign exchange of 1 percent and the impact of higher
prices of 1 percent.
Sales for our Turbo Technologies business were 6 percent higher in 2006 compared to 2005 primarily due to new product
introductions in Europe and Asia, a slight increase in diesel penetration in Europe and relatively flat sales in the U.S. Sales were 5
percent higher in 2005 compared to 2004 due to higher volumes in our North American truck segment, offset by lower volumes in
Europe due to a shift in consumer demand among automotive platforms partially offset by a slight increase in diesel penetration.
Sales for our Consumer Products Group business decreased by 4 percent in 2006 as a result of reduced consumer spending in
North America on automotive aftermarket products and our exit of the North America Friction Materials OE business. Sales increased
by 8 percent in 2005 compared to 2004
29