Honeywell 2006 Annual Report Download - page 41
Download and view the complete annual report
Please find page 41 of the 2006 Honeywell annual report below. You can navigate through the pages in the report by either clicking on the pages listed below, or by using the keyword search tool below to find specific information within the annual report.-
 1
1 -
2
-
3
-
4
-
5
-
6
-
7
-
8
-
9
-
10
-
11
-
12
-
13
-
14
-
15
-
16
-
17
-
18
-
19
-
20
-
21
-
22
-
23
-
24
-
25
-
26
-
27
-
28
-
29
-
30
-
 31
31 -
 32
32 -
 33
33 -
 34
34 -
 35
35 -
 36
36 -
 37
37 -
 38
38 -
 39
39 -
 40
40 -
 41
41 -
 42
42 -
 43
43 -
 44
44 -
 45
45 -
 46
46 -
 47
47 -
 48
48 -
 49
49 -
 50
50 -
 51
51 -
52
-
53
-
54
-
55
-
56
-
57
-
58
-
59
-
60
-
61
-
62
-
63
-
64
-
65
-
66
-
67
-
68
-
69
-
70
-
71
-
72
-
73
-
74
-
75
-
76
-
77
-
78
-
79
-
80
-
81
-
82
-
83
-
84
-
85
-
86
-
87
-
88
-
89
-
90
-
91
-
92
-
93
-
94
-
95
-
96
-
97
-
98
-
99
-
100
-
101
-
102
-
103
-
104
-
105
-
106
-
107
-
108
-
109
-
110
-
111
-
112
-
113
-
114
-
115
-
116
-
117
-
118
-
119
-
120
-
121
-
122
-
123
-
124
-
125
-
126
-
127
-
128
-
129
-
130
-
131
-
132
-
133
-
134
-
135
-
136
-
137
-
138
-
139
-
140
-
141
-
142
-
143
-
144
-
145
-
146
-
147
-
148
-
149
-
150
-
151
-
152
-
153
-
154
-
155
-
156
-
157
-
158
-
159
-
160
-
161
-
162
-
163
-
164
-
165
-
166
-
167
-
168
-
169
-
170
-
171
-
172
-
173
-
174
-
175
-
176
-
177
-
178
-
179
-
180
-
181
-
182
-
183
-
184
-
185
-
186
-
187
-
188
-
189
-
190
-
191
-
192
-
193
-
194
-
195
-
196
-
197
-
198
-
199
-
200
-
201
-
202
-
203
-
204
-
205
-
206
-
207
-
208
-
209
-
210
-
211
-
212
-
213
-
214
-
215
-
216
-
217
 |
 |

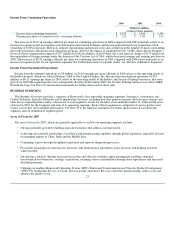
Materials also provides process technology, products and services for the petroleum refining, petrochemical, and other industries.
Specialty Materials' product portfolio includes fluorocarbons, caprolactam, ammonium sulfate for fertilizer, specialty films, advanced
fibers, customized research chemicals and intermediates, electronic materials and chemicals, catalysts, and adsorbents.
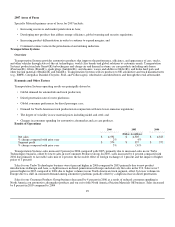
Economic and Other Factors
Specialty Materials operating results are principally driven by:
• The degree of volatility in natural gas, benzene (the key component in phenol) and fluorspar prices;
• The impact of environmental and energy efficiency regulations;
• The extent of change in order rates from global semiconductor customers;
• The global demand for non-ozone depleting Hydro fluorocarbons (HFC's);
• The extent of the slowdown of the US residential housing industry; and
• The level of investment in refining and petrochemical capacity, utilization and/or expansion.
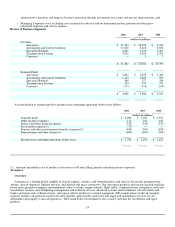
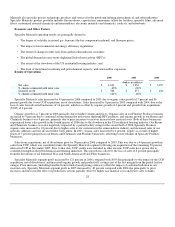
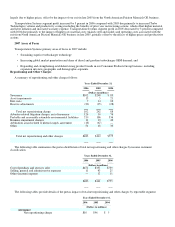
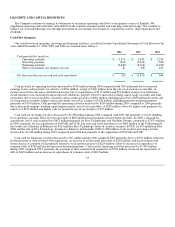
Results of Operations
2006 2005 2004
(Dollars in millions)
Net sales $ 4,631 $ 3,234 $ 3,497
% change compared with prior year 43% (8)%
Segment profit $ 568 $ 257 $ 184
% change compared with prior year 121% 40%
Specialty Materials sales increased by 43 percent in 2006 compared to 2005 due to organic sales growth of 7 percent and 36
percent growth due to our UOP acquisition, net of divestitures. Sales decreased by 8 percent in 2005 compared with 2004, due to the
loss of sales from divested businesses of 16 percent, which was offset by organic growth of 4 percent and growth from acquisitions
(UOP) of 4 percent.
Organic growth was 7 percent in 2006 primarily due to higher volume and prices. Organic sales in our Fluorine Products business
increased by 9 percent due to continued strong demand for non-ozone depleting HFC products, and organic growth in our Resins and
Chemicals business was 4 percent, primarily due to price increases to recover increased raw material costs. Both of these businesses
experienced lower sales growth in the fourth quarter of 2006 due to the slowdown in the US residential housing industry. Our Resins
and Chemicals business was also negatively impacted by a partial facility outage in the second half of 2006. Specialty Products
organic sales increased by 10 percent due to higher sales to our customers in the semiconductor industry and increased sales of our
specialty additives and our advanced fiber body armor. In 2005, organic sales increased by 4 percent, largely as a result of higher
prices of 7 percent primarily in our Resins and Chemicals and Fluorine businesses, offsetting lower volumes in Specialty Products
businesses.
Sales from acquisitions, net of divestitures grew by 36 percent in 2006 compared to 2005. This was due to a 44 percent growth in
sales from UOP, which was consolidated into the Specialty Materials segment following our acquisition of the remaining 50 percent
interest in UOP in November 2005. Prior to that date, UOP results were included in other income. UOP sales have grown due to
continued strength in the petrochemical and refining industries. This growth was offset by the loss of sales of 8 percent principally
from the divestiture of our Industrial Wax and North American Nylon Fiber businesses.
Specialty Materials segment profit increased by 121 percent in 2006 compared with 2005 due principally to the impact of the UOP
acquisition, net of divestitures, and increased organic growth and productivity savings (net of the lost margin from the partial facility
outage). Price increases (including benefits from formula based pricing contracts) offset the impact of continued inflation in raw
material costs. Specialty Materials segment profit in 2005 increased by 40 percent compared with 2004 due principally to price
increases and the favorable effect of productivity actions partially offset by higher raw material costs and lower sales volumes.
28