Honeywell 2006 Annual Report Download - page 117
Download and view the complete annual report
Please find page 117 of the 2006 Honeywell annual report below. You can navigate through the pages in the report by either clicking on the pages listed below, or by using the keyword search tool below to find specific information within the annual report.-
 1
1 -
2
-
3
-
4
-
5
-
6
-
7
-
8
-
9
-
10
-
11
-
12
-
13
-
14
-
15
-
16
-
17
-
18
-
19
-
20
-
21
-
22
-
23
-
24
-
25
-
26
-
27
-
28
-
29
-
30
-
31
-
32
-
33
-
34
-
35
-
36
-
37
-
38
-
39
-
40
-
41
-
42
-
43
-
44
-
45
-
46
-
47
-
48
-
49
-
50
-
51
-
52
-
53
-
54
-
55
-
56
-
57
-
58
-
59
-
60
-
61
-
62
-
63
-
64
-
65
-
66
-
67
-
68
-
69
-
70
-
71
-
72
-
73
-
74
-
75
-
76
-
77
-
78
-
79
-
80
-
81
-
82
-
83
-
84
-
85
-
86
-
87
-
88
-
89
-
90
-
91
-
92
-
93
-
94
-
95
-
96
-
97
-
98
-
99
-
100
-
101
-
102
-
103
-
104
-
105
-
106
-
 107
107 -
 108
108 -
 109
109 -
 110
110 -
 111
111 -
 112
112 -
 113
113 -
 114
114 -
 115
115 -
 116
116 -
 117
117 -
 118
118 -
 119
119 -
 120
120 -
 121
121 -
 122
122 -
 123
123 -
 124
124 -
 125
125 -
 126
126 -
 127
127 -
128
-
129
-
130
-
131
-
132
-
133
-
134
-
135
-
136
-
137
-
138
-
139
-
140
-
141
-
142
-
143
-
144
-
145
-
146
-
147
-
148
-
149
-
150
-
151
-
152
-
153
-
154
-
155
-
156
-
157
-
158
-
159
-
160
-
161
-
162
-
163
-
164
-
165
-
166
-
167
-
168
-
169
-
170
-
171
-
172
-
173
-
174
-
175
-
176
-
177
-
178
-
179
-
180
-
181
-
182
-
183
-
184
-
185
-
186
-
187
-
188
-
189
-
190
-
191
-
192
-
193
-
194
-
195
-
196
-
197
-
198
-
199
-
200
-
201
-
202
-
203
-
204
-
205
-
206
-
207
-
208
-
209
-
210
-
211
-
212
-
213
-
214
-
215
-
216
-
217
 |
 |

HONEYWELL INTERNATIONAL INC.
NOTES TO FINANCIAL STATEMENTS—(Continued)
(Dollars in millions, except per share amounts)
We also sponsor postretirement benefit plans that provide health care benefits and life insurance coverage to eligible retirees. Our
retiree medical plans mainly cover U.S. employees who retire with pension eligibility for hospital, professional and other medical
services. All non-union hourly and salaried employees joining Honeywell after January 1, 2000 are not eligible to participate in our
retiree medical and life insurance plans. Most of the U.S. retiree medical plans require deductibles and copayments, and virtually all
are integrated with Medicare. Retiree contributions are generally required based on coverage type, plan and Medicare eligibility.
Honeywell has limited its subsidy of its retiree medical plans to a fixed-dollar amount for substantially all future retirees and for
almost half of its current retirees. This cap of retiree medical benefits under our plans limits our exposure to the impact of future health
care cost increases. The retiree medical and life insurance plans are not funded. Claims and expenses are paid from our operating cash
flow.
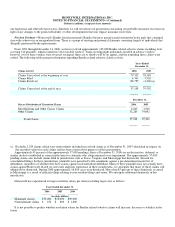
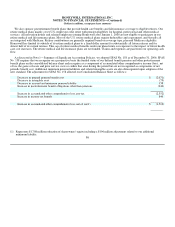
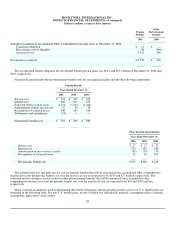
As discussed in Note 1—Summary of Significant Accounting Policies, we adopted SFAS No. 158 as of December 31, 2006. SFAS
No. 158 requires that we recognize on a prospective basis the funded status of our defined benefit pension and other postretirement
benefit plans on the consolidated balance sheet and recognize as a component of accumulated other comprehensive income (loss), net
of tax, the gains or losses and prior service costs or credits that arise during the period but are not recognized as components of net
periodic benefit cost. Additional minimum pension liabilities and related intangible assets are also derecognized upon adoption of the
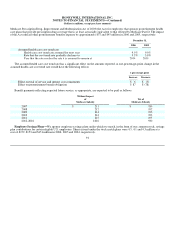
new standard. The adjustment for SFAS No. 158 affected our Consolidated Balance Sheet as follows:
Decrease in prepaid pension benefit cost $ (2,071)
Decrease in intangible asset (79)
Decrease in accrued and minimum pension liability 138
Increase in postretirement benefit obligations other than pensions (340)
Increase in accumulated other comprehensive loss, pre-tax (2,352)
Increase in income tax benefit 840
Increase in accumulated other comprehensive loss, net of tax(1) $ (1,512)
(1)
Represents $1,708 million reduction of shareowners' equity including a $196 million adjustment related to our additional
minimum liability.
86