Honeywell 2006 Annual Report Download - page 43
Download and view the complete annual report
Please find page 43 of the 2006 Honeywell annual report below. You can navigate through the pages in the report by either clicking on the pages listed below, or by using the keyword search tool below to find specific information within the annual report.-
 1
1 -
2
-
3
-
4
-
5
-
6
-
7
-
8
-
9
-
10
-
11
-
12
-
13
-
14
-
15
-
16
-
17
-
18
-
19
-
20
-
21
-
22
-
23
-
24
-
25
-
26
-
27
-
28
-
29
-
30
-
31
-
32
-
 33
33 -
 34
34 -
 35
35 -
 36
36 -
 37
37 -
 38
38 -
 39
39 -
 40
40 -
 41
41 -
 42
42 -
 43
43 -
 44
44 -
 45
45 -
 46
46 -
 47
47 -
 48
48 -
 49
49 -
 50
50 -
 51
51 -
 52
52 -
 53
53 -
54
-
55
-
56
-
57
-
58
-
59
-
60
-
61
-
62
-
63
-
64
-
65
-
66
-
67
-
68
-
69
-
70
-
71
-
72
-
73
-
74
-
75
-
76
-
77
-
78
-
79
-
80
-
81
-
82
-
83
-
84
-
85
-
86
-
87
-
88
-
89
-
90
-
91
-
92
-
93
-
94
-
95
-
96
-
97
-
98
-
99
-
100
-
101
-
102
-
103
-
104
-
105
-
106
-
107
-
108
-
109
-
110
-
111
-
112
-
113
-
114
-
115
-
116
-
117
-
118
-
119
-
120
-
121
-
122
-
123
-
124
-
125
-
126
-
127
-
128
-
129
-
130
-
131
-
132
-
133
-
134
-
135
-
136
-
137
-
138
-
139
-
140
-
141
-
142
-
143
-
144
-
145
-
146
-
147
-
148
-
149
-
150
-
151
-
152
-
153
-
154
-
155
-
156
-
157
-
158
-
159
-
160
-
161
-
162
-
163
-
164
-
165
-
166
-
167
-
168
-
169
-
170
-
171
-
172
-
173
-
174
-
175
-
176
-
177
-
178
-
179
-
180
-
181
-
182
-
183
-
184
-
185
-
186
-
187
-
188
-
189
-
190
-
191
-
192
-
193
-
194
-
195
-
196
-
197
-
198
-
199
-
200
-
201
-
202
-
203
-
204
-
205
-
206
-
207
-
208
-
209
-
210
-
211
-
212
-
213
-
214
-
215
-
216
-
217
 |
 |

largely due to higher prices, offset by the impact of our exit in late 2005 from the North American Friction Materials OE business.
Transportation Systems segment profit increased by 3 percent in 2006 compared with 2005 due primarily to increased Turbo
Technologies volume and productivity savings including the benefits of prior year restructuring actions, which offset higher material
and labor inflation and increased warranty expense. Transportation Systems segment profit in 2005 decreased by 3 percent compared
with 2004 due primarily to the impact of higher raw material costs (mainly steel and nickel) and operating costs associated with the
exit from North American Friction Materials OE business in late 2005, partially offset by the effects of higher prices and productivity
actions.
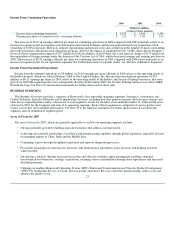
2007 Areas of Focus
Transportation Systems primary areas of focus in 2007 include:
• Sustaining superior turbocharger technology;
• Increasing global market penetration and share of diesel and gasoline turbocharger OEM demand; and
• Expanding and strengthening established strong product brands in our Consumer Products Group business, including
expansion into new geographic and demographic segments.
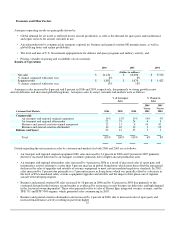
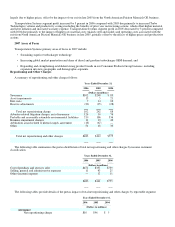
Repositioning and Other Charges
A summary of repositioning and other charges follows:
Years Ended December 31,
2006 2005 2004
(Dollars in millions)
Severance $102 $248 $ 85
Asset impairments 15 5 21
Exit costs 7 14 10
Reserve adjustments (22) (25) (28)
Total net repositioning charge 102 242 88
Asbestos related litigation charges, net of insurance 126 10 76
Probable and reasonably estimable environmental liabilities 210 186 536
Business impairment charges 12 23 42
Arbitration award related to phenol supply agreement (18) (67) —
Other 51 18 33
Total net repositioning and other charges $483 $412 $775
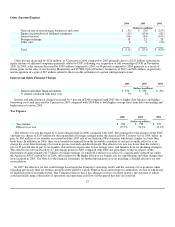
The following table summarizes the pretax distribution of total net repositioning and other charges by income statement
classification.
Years Ended December 31,
2006 2005 2004
(Dollars in millions)
Cost of products and services sold $472 $357 $739
Selling, general and administrative expenses 11 43 25
Other (income) expense — 12 11
$483 $412 $775
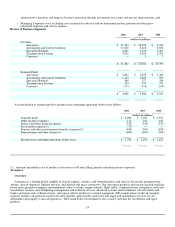
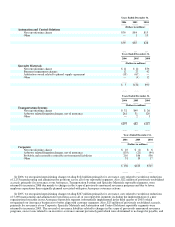
The following tables provide details of the pretax impact of total net repositioning and other charges by reportable segment.
Years Ended December 31,
2006 2005 2004
(Dollars in millions)
Aerospace
Net repositioning charge $10 $96 $ 5