Honeywell 2006 Annual Report Download - page 120
Download and view the complete annual report
Please find page 120 of the 2006 Honeywell annual report below. You can navigate through the pages in the report by either clicking on the pages listed below, or by using the keyword search tool below to find specific information within the annual report.-
 1
1 -
2
-
3
-
4
-
5
-
6
-
7
-
8
-
9
-
10
-
11
-
12
-
13
-
14
-
15
-
16
-
17
-
18
-
19
-
20
-
21
-
22
-
23
-
24
-
25
-
26
-
27
-
28
-
29
-
30
-
31
-
32
-
33
-
34
-
35
-
36
-
37
-
38
-
39
-
40
-
41
-
42
-
43
-
44
-
45
-
46
-
47
-
48
-
49
-
50
-
51
-
52
-
53
-
54
-
55
-
56
-
57
-
58
-
59
-
60
-
61
-
62
-
63
-
64
-
65
-
66
-
67
-
68
-
69
-
70
-
71
-
72
-
73
-
74
-
75
-
76
-
77
-
78
-
79
-
80
-
81
-
82
-
83
-
84
-
85
-
86
-
87
-
88
-
89
-
90
-
91
-
92
-
93
-
94
-
95
-
96
-
97
-
98
-
99
-
100
-
101
-
102
-
103
-
104
-
105
-
106
-
107
-
108
-
109
-
 110
110 -
 111
111 -
 112
112 -
 113
113 -
 114
114 -
 115
115 -
 116
116 -
 117
117 -
 118
118 -
 119
119 -
 120
120 -
 121
121 -
 122
122 -
 123
123 -
 124
124 -
 125
125 -
 126
126 -
 127
127 -
 128
128 -
 129
129 -
 130
130 -
131
-
132
-
133
-
134
-
135
-
136
-
137
-
138
-
139
-
140
-
141
-
142
-
143
-
144
-
145
-
146
-
147
-
148
-
149
-
150
-
151
-
152
-
153
-
154
-
155
-
156
-
157
-
158
-
159
-
160
-
161
-
162
-
163
-
164
-
165
-
166
-
167
-
168
-
169
-
170
-
171
-
172
-
173
-
174
-
175
-
176
-
177
-
178
-
179
-
180
-
181
-
182
-
183
-
184
-
185
-
186
-
187
-
188
-
189
-
190
-
191
-
192
-
193
-
194
-
195
-
196
-
197
-
198
-
199
-
200
-
201
-
202
-
203
-
204
-
205
-
206
-
207
-
208
-
209
-
210
-
211
-
212
-
213
-
214
-
215
-
216
-
217
 |
 |

HONEYWELL INTERNATIONAL INC.
NOTES TO FINANCIAL STATEMENTS—(Continued)
(Dollars in millions, except per share amounts)
Pension
Benefits
Other
Postretirement
Benefits
2006 2006
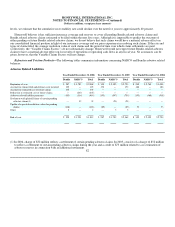
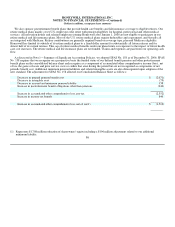
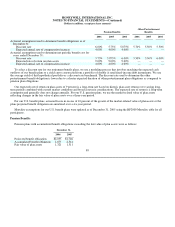
Amounts recognized in Accumulated Other Comprehensive Income (loss) at December 31, 2006
Transition obligation $ 11 $ —
Prior service cost or (benefit) 98 (146)
Actuarial losses 2,423 486
Net amount recognized $ 2,532 $ 340
The accumulated benefit obligation for our defined benefit pension plans was $16.2 and $15.4 billion at December 31, 2006 and
2005, respectively.
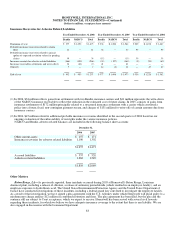
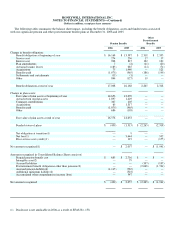
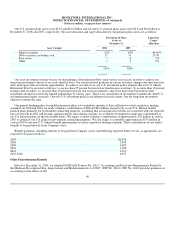
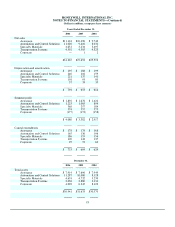
Net periodic pension and other postretirement benefit costs for our significant plans include the following components:
Pension Benefits
Years Ended December 31,
2006 2005 2004
Service cost $ 274 $ 236 $ 222
Interest cost 908 815 755
Expected return on plan assets (1,251) (1,104) (1,042)
Amortization of prior service cost 27 30 38
Recognition of actuarial losses 348 392 413
Settlements and curtailments (13) — —
Net periodic benefit cost $ 293 $ 369 $ 386
Other Postretirement Benefits
Years Ended December 31,
2006 2005 2004
Service cost $ 17 $ 17 $ 17
Interest cost 122 120 138
Amortization of prior service (credit) (40) (39) (37)
Recognition of actuarial losses 52 63 101
Net periodic benefit cost $ 151 $ 161 $ 219
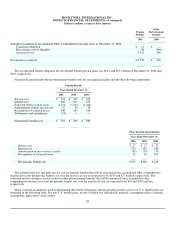
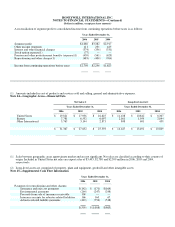
The estimated net loss and prior service cost for pension benefits that will be amortized from accumulated other comprehensive
income (loss) into net periodic benefit cost over the next fiscal year are expected to be $193 and $27 million, respectively. The
estimated net loss and prior service credit for other postretirement benefits that will be amortized from accumulated other
comprehensive income (loss) into net periodic benefit cost over the next fiscal year are expected to be $45 and $(40) million,
respectively.
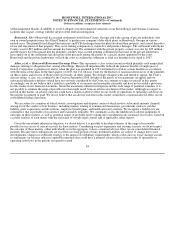
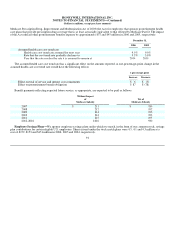
Major actuarial assumptions used in determining the benefit obligations and net periodic benefit cost for our U.S. benefit plans are
presented in the following table. For non-U.S. benefit plans, no one of which was individually material, assumptions reflect economic
assumptions applicable to each country.
88