Honeywell 2006 Annual Report Download - page 201
Download and view the complete annual report
Please find page 201 of the 2006 Honeywell annual report below. You can navigate through the pages in the report by either clicking on the pages listed below, or by using the keyword search tool below to find specific information within the annual report.-
 1
1 -
2
-
3
-
4
-
5
-
6
-
7
-
8
-
9
-
10
-
11
-
12
-
13
-
14
-
15
-
16
-
17
-
18
-
19
-
20
-
21
-
22
-
23
-
24
-
25
-
26
-
27
-
28
-
29
-
30
-
31
-
32
-
33
-
34
-
35
-
36
-
37
-
38
-
39
-
40
-
41
-
42
-
43
-
44
-
45
-
46
-
47
-
48
-
49
-
50
-
51
-
52
-
53
-
54
-
55
-
56
-
57
-
58
-
59
-
60
-
61
-
62
-
63
-
64
-
65
-
66
-
67
-
68
-
69
-
70
-
71
-
72
-
73
-
74
-
75
-
76
-
77
-
78
-
79
-
80
-
81
-
82
-
83
-
84
-
85
-
86
-
87
-
88
-
89
-
90
-
91
-
92
-
93
-
94
-
95
-
96
-
97
-
98
-
99
-
100
-
101
-
102
-
103
-
104
-
105
-
106
-
107
-
108
-
109
-
110
-
111
-
112
-
113
-
114
-
115
-
116
-
117
-
118
-
119
-
120
-
121
-
122
-
123
-
124
-
125
-
126
-
127
-
128
-
129
-
130
-
131
-
132
-
133
-
134
-
135
-
136
-
137
-
138
-
139
-
140
-
141
-
142
-
143
-
144
-
145
-
146
-
147
-
148
-
149
-
150
-
151
-
152
-
153
-
154
-
155
-
156
-
157
-
158
-
159
-
160
-
161
-
162
-
163
-
164
-
165
-
166
-
167
-
168
-
169
-
170
-
171
-
172
-
173
-
174
-
175
-
176
-
177
-
178
-
179
-
180
-
181
-
182
-
183
-
184
-
185
-
186
-
187
-
188
-
189
-
190
-
 191
191 -
 192
192 -
 193
193 -
 194
194 -
 195
195 -
 196
196 -
 197
197 -
 198
198 -
 199
199 -
 200
200 -
 201
201 -
 202
202 -
 203
203 -
 204
204 -
 205
205 -
 206
206 -
 207
207 -
 208
208 -
 209
209 -
 210
210 -
 211
211 -
212
-
213
-
214
-
215
-
216
-
217
 |
 |
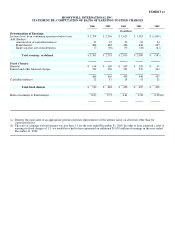
EXHIBIT 12
HONEYWELL INTERNATIONAL INC.
STATEMENT RE: COMPUTATION OF RATIO OF EARNINGS TO FIXED CHARGES
2006 2005 2004 2003 2002
(In millions)
Determination of Earnings:
Income (loss) from continuing operations before taxes $ 2,798 $ 2,296 $ 1,623 $ 1,583 $ (1,000)
Add (Deduct):
Amortization of capitalized interest 22 22 24 24 24
Fixed charges 488 465 438 440 435
Equity income, net of distributions (7) (30) (75) (38) (42)
Total earnings, as defined $ 3,301 $ 2,753 $ 2,010 $ 2,009 $ (583)
Fixed Charges:
Rents(a) $ 114 $ 109 $ 107 $ 105 $ 91
Interest and other financial charges 374 356 331 335 344
488 465 438 440 435
Capitalized interest 22 17 18 15 21
Total fixed charges $ 510 $ 482 $ 456 $ 455 $ 456
Ratio of earnings to fixed charges 6.47 5.71 4.41 4.42 (1.28)(b)
(a) Denotes the equivalent of an appropriate portion of rentals representative of the interest factor on all rentals other than for
capitalized leases.
(b) The ratio of earnings to fixed charges was less than 1:1 for the year ended December 31, 2002. In order to have achieved a ratio of
earnings to fixed charges of 1:1, we would have had to have generated an additional $1,039 million of earnings in the year ended
December 31, 2002.