Honeywell 2006 Annual Report Download - page 54
Download and view the complete annual report
Please find page 54 of the 2006 Honeywell annual report below. You can navigate through the pages in the report by either clicking on the pages listed below, or by using the keyword search tool below to find specific information within the annual report.-
 1
1 -
2
-
3
-
4
-
5
-
6
-
7
-
8
-
9
-
10
-
11
-
12
-
13
-
14
-
15
-
16
-
17
-
18
-
19
-
20
-
21
-
22
-
23
-
24
-
25
-
26
-
27
-
28
-
29
-
30
-
31
-
32
-
33
-
34
-
35
-
36
-
37
-
38
-
39
-
40
-
41
-
42
-
43
-
 44
44 -
 45
45 -
 46
46 -
 47
47 -
 48
48 -
 49
49 -
 50
50 -
 51
51 -
 52
52 -
 53
53 -
 54
54 -
 55
55 -
 56
56 -
 57
57 -
 58
58 -
 59
59 -
 60
60 -
 61
61 -
 62
62 -
 63
63 -
 64
64 -
65
-
66
-
67
-
68
-
69
-
70
-
71
-
72
-
73
-
74
-
75
-
76
-
77
-
78
-
79
-
80
-
81
-
82
-
83
-
84
-
85
-
86
-
87
-
88
-
89
-
90
-
91
-
92
-
93
-
94
-
95
-
96
-
97
-
98
-
99
-
100
-
101
-
102
-
103
-
104
-
105
-
106
-
107
-
108
-
109
-
110
-
111
-
112
-
113
-
114
-
115
-
116
-
117
-
118
-
119
-
120
-
121
-
122
-
123
-
124
-
125
-
126
-
127
-
128
-
129
-
130
-
131
-
132
-
133
-
134
-
135
-
136
-
137
-
138
-
139
-
140
-
141
-
142
-
143
-
144
-
145
-
146
-
147
-
148
-
149
-
150
-
151
-
152
-
153
-
154
-
155
-
156
-
157
-
158
-
159
-
160
-
161
-
162
-
163
-
164
-
165
-
166
-
167
-
168
-
169
-
170
-
171
-
172
-
173
-
174
-
175
-
176
-
177
-
178
-
179
-
180
-
181
-
182
-
183
-
184
-
185
-
186
-
187
-
188
-
189
-
190
-
191
-
192
-
193
-
194
-
195
-
196
-
197
-
198
-
199
-
200
-
201
-
202
-
203
-
204
-
205
-
206
-
207
-
208
-
209
-
210
-
211
-
212
-
213
-
214
-
215
-
216
-
217
 |
 |

instruments. We monitor the impact of market risk on the fair value and expected future cash flows of our derivative and other
financial instruments considering reasonably possible changes in interest and currency exchange rates and restrict the use of derivative
financial instruments to hedging activities.
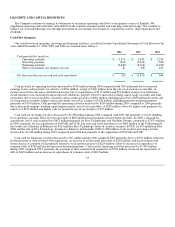
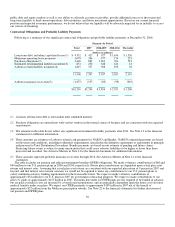
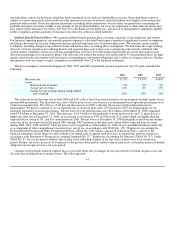
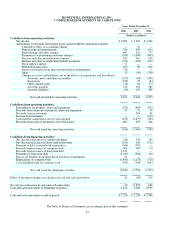
The following table illustrates the potential change in fair value for interest rate sensitive instruments based on a hypothetical
immediate one-percentage-point increase in interest rates across all maturities, the potential change in fair value for foreign exchange
rate sensitive instruments based on a 10 percent weakening of the U.S. dollar versus local currency exchange rates across all
maturities, and the potential change in fair value of contracts hedging commodity purchases based on a 20 percent decrease in the
price of the underlying commodity across all maturities at December 31, 2006 and 2005.
Face or
Notional
Amount
Carrying
Value(1)
Fair
Value(1)
Estimated
Increase
(Decrease)
In Fair
Value
(Dollars in millions)
December 31, 2006
Interest Rate Sensitive Instruments
Long-term debt (including current maturities) $ (4,329) $ (4,332) $ (4,521) $ (194)
Interest rate swap agreements 700 3 3 (31)
Foreign Exchange Rate Sensitive Instruments
Foreign currency exchange contracts(2) 2,572 — — 8
Commodity Price Sensitive Instruments
Forward commodity contracts(3) 60 (9) (9) (10)
December 31, 2005
Interest Rate Sensitive Instruments
Long-term debt (including current maturities) $ (4,070) $ (4,077) $ (4,291) $ (88)
Interest rate swap agreements 681 9 9 (5)
Foreign Exchange Rate Sensitive Instruments
Foreign currency exchange contracts(2) 1,998 (2) (2) (36)
Commodity Price Sensitive Instruments
Forward commodity contracts(3) 141 17 17 (12)
(1) Asset or (liability).
(2)
Changes in the fair value of foreign currency exchange contracts are offset by changes in the fair value or cash flows of
underlying hedged foreign currency transactions.
(3)
Changes in the fair value of forward commodity contracts are offset by changes in the cash flows of underlying hedged
commodity transactions.
The above discussion of our procedures to monitor market risk and the estimated changes in fair value resulting from our
sensitivity analyses are forward-looking statements of market risk assuming certain adverse market conditions occur. Actual results in
the future may differ materially from these estimated results due to actual developments in the global financial markets. The methods
used by us to assess and mitigate risk discussed above should not be considered projections of future events.
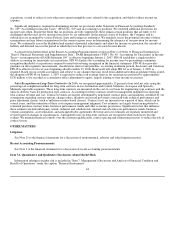
CRITICAL ACCOUNTING POLICIES
The preparation of our consolidated financial statements in accordance with generally accepted accounting principles is based on
the selection and application of accounting policies that require us to make significant estimates and assumptions about the effects of
matters that are inherently uncertain. We consider the accounting policies discussed below to be critical to the understanding of our
financial statements. Actual results could differ from our estimates and assumptions, and any such differences could be material to our
consolidated financial statements.
We have discussed the selection, application and disclosure of these critical accounting policies with the Audit Committee of our
Board of Directors and our Independent Registered Public
39