Honeywell 2006 Annual Report Download - page 51
Download and view the complete annual report
Please find page 51 of the 2006 Honeywell annual report below. You can navigate through the pages in the report by either clicking on the pages listed below, or by using the keyword search tool below to find specific information within the annual report.-
 1
1 -
2
-
3
-
4
-
5
-
6
-
7
-
8
-
9
-
10
-
11
-
12
-
13
-
14
-
15
-
16
-
17
-
18
-
19
-
20
-
21
-
22
-
23
-
24
-
25
-
26
-
27
-
28
-
29
-
30
-
31
-
32
-
33
-
34
-
35
-
36
-
37
-
38
-
39
-
40
-
 41
41 -
 42
42 -
 43
43 -
 44
44 -
 45
45 -
 46
46 -
 47
47 -
 48
48 -
 49
49 -
 50
50 -
 51
51 -
 52
52 -
 53
53 -
 54
54 -
 55
55 -
 56
56 -
 57
57 -
 58
58 -
 59
59 -
 60
60 -
 61
61 -
62
-
63
-
64
-
65
-
66
-
67
-
68
-
69
-
70
-
71
-
72
-
73
-
74
-
75
-
76
-
77
-
78
-
79
-
80
-
81
-
82
-
83
-
84
-
85
-
86
-
87
-
88
-
89
-
90
-
91
-
92
-
93
-
94
-
95
-
96
-
97
-
98
-
99
-
100
-
101
-
102
-
103
-
104
-
105
-
106
-
107
-
108
-
109
-
110
-
111
-
112
-
113
-
114
-
115
-
116
-
117
-
118
-
119
-
120
-
121
-
122
-
123
-
124
-
125
-
126
-
127
-
128
-
129
-
130
-
131
-
132
-
133
-
134
-
135
-
136
-
137
-
138
-
139
-
140
-
141
-
142
-
143
-
144
-
145
-
146
-
147
-
148
-
149
-
150
-
151
-
152
-
153
-
154
-
155
-
156
-
157
-
158
-
159
-
160
-
161
-
162
-
163
-
164
-
165
-
166
-
167
-
168
-
169
-
170
-
171
-
172
-
173
-
174
-
175
-
176
-
177
-
178
-
179
-
180
-
181
-
182
-
183
-
184
-
185
-
186
-
187
-
188
-
189
-
190
-
191
-
192
-
193
-
194
-
195
-
196
-
197
-
198
-
199
-
200
-
201
-
202
-
203
-
204
-
205
-
206
-
207
-
208
-
209
-
210
-
211
-
212
-
213
-
214
-
215
-
216
-
217
 |
 |

public debt and equity markets as well as our ability to sell trade accounts receivables, provide additional sources of short-term and
long-term liquidity to fund current operations, debt maturities, and future investment opportunities. Based on our current financial
position and expected economic performance, we do not believe that our liquidity will be adversely impacted by an inability to access
our sources of financing.
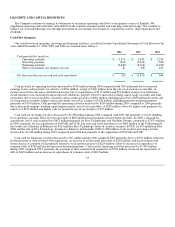
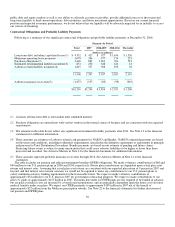
Contractual Obligations and Probable Liability Payments
Following is a summary of our significant contractual obligations and probable liability payments at December 31, 2006:
Payments by Period
Total 2007 2008-2009 2010-2011 Thereafter
(Dollars in millions)
Long-term debt, including capitalized leases(1) $ 4,332 $ 423 $ 927 $ 1,656 $ 1,326
Minimum operating lease payments 1,078 304 377 174 223
Purchase obligations(2) 3,446 863 1,361 704 518
Estimated environmental liability payments(3) 831 250 346 221 14
Asbestos related liability payments(4) 1,819 557 926 298 38
11,506 2,397 3,937 3,053 2,119
Asbestos insurance recoveries(5) (1,257) (157) (83) (98) (919)
$10,249 $2,240 $ 3,854 $ 2,955 $ 1,200
(1) Assumes all long-term debt is outstanding until scheduled maturity.
(2)
Purchase obligations are entered into with various vendors in the normal course of business and are consistent with our expected
requirements.
(3)
The amounts in the table do not reflect any significant environmental liability payments after 2011. See Note 21 to the financial
statements for additional information.
(4)
These amounts are estimates of asbestos related cash payments for NARCO and Bendix. NARCO estimated payments are based
on the terms and conditions, including evidentiary requirements, specified in the definitive agreements or agreements in principle
and pursuant to Trust Distribution Procedures. Bendix payments are based on our estimate of pending and future claims.
Projecting future events is subject to many uncertainties that could cause asbestos liabilities to be higher or lower than those
projected and recorded. See Asbestos Matters in Note 21 to the financial statements for additional information.
(5)
These amounts represent probable insurance recoveries through 2018. See Asbestos Matters in Note 21 to the financial
statements.
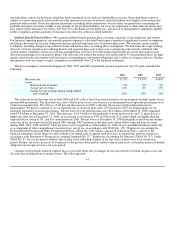
The table excludes our pension and other postretirement benefits (OPEB) obligations. We made voluntary contributions of $68 and
$40 million to our U.S. pension plans in 2006 and 2004, respectively. Future plan contributions are dependent upon actual plan asset
returns and interest rates. Assuming that actual plan asset returns are consistent with our expected plan return of 9 percent in 2007 and
beyond, and that interest rates remain constant, we would not be required to make any contributions to our U.S. pension plans to
satisfy minimum statutory funding requirements for the foreseeable future. We expect to make voluntary contributions of
approximately $52 million to our U.S. plans in 2007 for government contracting purposes. We expect to make contributions to our
non-U.S. plans of approximately $155 million in 2007. Payments due under our OPEB plans are not required to be funded in advance,
but are paid as medical costs are incurred by covered retiree populations, and are principally dependent upon the future cost of retiree
medical benefits under our plans. We expect our OPEB payments to approximate $189 million in 2007 net of the benefit of
approximately $22 million from the Medicare prescription subsidy. See Note 22 to the financial statements for further discussion of
our pension and OPEB plans.
36