Honeywell 2006 Annual Report Download - page 34
Download and view the complete annual report
Please find page 34 of the 2006 Honeywell annual report below. You can navigate through the pages in the report by either clicking on the pages listed below, or by using the keyword search tool below to find specific information within the annual report.-
 1
1 -
2
-
3
-
4
-
5
-
6
-
7
-
8
-
9
-
10
-
11
-
12
-
13
-
14
-
15
-
16
-
17
-
18
-
19
-
20
-
21
-
22
-
23
-
 24
24 -
 25
25 -
 26
26 -
 27
27 -
 28
28 -
 29
29 -
 30
30 -
 31
31 -
 32
32 -
 33
33 -
 34
34 -
 35
35 -
 36
36 -
 37
37 -
 38
38 -
 39
39 -
 40
40 -
 41
41 -
 42
42 -
 43
43 -
 44
44 -
45
-
46
-
47
-
48
-
49
-
50
-
51
-
52
-
53
-
54
-
55
-
56
-
57
-
58
-
59
-
60
-
61
-
62
-
63
-
64
-
65
-
66
-
67
-
68
-
69
-
70
-
71
-
72
-
73
-
74
-
75
-
76
-
77
-
78
-
79
-
80
-
81
-
82
-
83
-
84
-
85
-
86
-
87
-
88
-
89
-
90
-
91
-
92
-
93
-
94
-
95
-
96
-
97
-
98
-
99
-
100
-
101
-
102
-
103
-
104
-
105
-
106
-
107
-
108
-
109
-
110
-
111
-
112
-
113
-
114
-
115
-
116
-
117
-
118
-
119
-
120
-
121
-
122
-
123
-
124
-
125
-
126
-
127
-
128
-
129
-
130
-
131
-
132
-
133
-
134
-
135
-
136
-
137
-
138
-
139
-
140
-
141
-
142
-
143
-
144
-
145
-
146
-
147
-
148
-
149
-
150
-
151
-
152
-
153
-
154
-
155
-
156
-
157
-
158
-
159
-
160
-
161
-
162
-
163
-
164
-
165
-
166
-
167
-
168
-
169
-
170
-
171
-
172
-
173
-
174
-
175
-
176
-
177
-
178
-
179
-
180
-
181
-
182
-
183
-
184
-
185
-
186
-
187
-
188
-
189
-
190
-
191
-
192
-
193
-
194
-
195
-
196
-
197
-
198
-
199
-
200
-
201
-
202
-
203
-
204
-
205
-
206
-
207
-
208
-
209
-
210
-
211
-
212
-
213
-
214
-
215
-
216
-
217
 |
 |

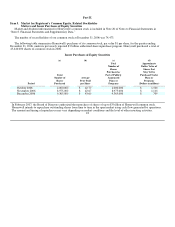
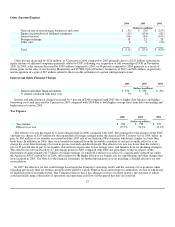
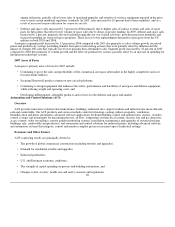
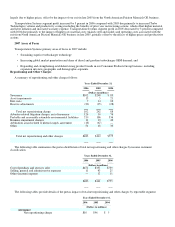
Income From Continuing Operations
2006 2005 2004
(Dollars in millions,
except per share amounts)
Income from continuing operations $ 2,078 $ 1,564 $ 1,246
Earnings per share of common stock—assuming dilution $ 2.51 $ 1.84 $ 1.45
The increase of $0.67 in earnings (diluted) per share for continuing operations in 2006 compared with 2005 primarily relates to an
increase in segment profit in Aerospace and Automation and Control Solutions and income generated from our acquisition of full
ownership of UOP in Specialty Materials, reduced repositioning and pension costs and a reduction in the number of shares outstanding
due to the previously announced stock repurchase program, offset by the impact of adopting FAS No. 123R (“Share-Based Payment”)
for stock-based compensation expense of $77 million in 2006. In addition, in 2005 there was a one-time tax charge of $155 million for
the repatriation of foreign earnings under the American Jobs Creation Act of 2004, which decreased earnings and earnings per share in
2005. The increase of $0.39 earnings (diluted) per share for continuing operations in 2005 compared with 2004 relates primarily to an
increase in segment profit for our reportable segments. For further discussion of segment results, see “Review of Business Segments”.
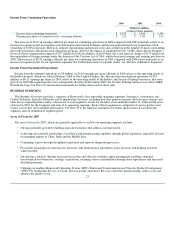
Income From Discontinued Operations
Income from discontinued operations of $5 million, or $0.01 earnings per share (diluted) in 2006 relates to the operating results of
the Indalex business which was sold in February 2006 to Sun Capital Partners, Inc. Income from discontinued operations of $95
million, or $0.11 earnings per share, in 2005 relates to the operating results of the Indalex and Security Printing businesses, that were
part of our NOVAR acquisition that were subsequently divested. In December 2005, the Security Printing business was sold to M&F
Worldwide Corp. See Note 2 to the financial statements for further discussion of these sales.
BUSINESS OVERVIEW
This Business Overview provides a summary of Honeywell's four reportable operating segments (Aerospace, Automation and
Control Solutions, Specialty Materials and Transportation Systems), including how they generate income, the relevant economic and
other factors impacting their results, a discussion of each segment's results for the three years ended December 31, 2006 and the areas
of focus for 2007 for the Company and each of its operating segments. Each of these segments is comprised of various product and
service classes that serve multiple end markets. See Note 23 to the financial statements for further information on our reportable
segments and our definition of segment profit.
Areas of Focus for 2007
The areas of focus for 2007, which are generally applicable to each of our operating segments, include:
• Driving profitable growth by building innovative products that address customer needs;
• Achieving sales growth, technological excellence and manufacturing capability through global expansion, especially focused
on emerging regions in China, India and the Middle East;
• Continuing to grow through disciplined acquisition and rigorous integration processes;
• Proactively managing raw material cost increases with formula price agreements, price increases and hedging activities,
where feasible;
• Driving free cash flow through increased net income and effective working capital management enabling continued
investment in our businesses, strategic acquisitions, returning value to shareholders through share repurchases and increased
dividend payments;
• Utilizing our enablers Honeywell Operating System (HOS), Functional Transformation and Velocity Product Development
(VPD)™to standardize the way we work, increase quality and reduce the costs of product manufacturing, reduce costs and
enhance the quality of our
23