Honeywell 2006 Annual Report Download - page 48
Download and view the complete annual report
Please find page 48 of the 2006 Honeywell annual report below. You can navigate through the pages in the report by either clicking on the pages listed below, or by using the keyword search tool below to find specific information within the annual report.-
 1
1 -
2
-
3
-
4
-
5
-
6
-
7
-
8
-
9
-
10
-
11
-
12
-
13
-
14
-
15
-
16
-
17
-
18
-
19
-
20
-
21
-
22
-
23
-
24
-
25
-
26
-
27
-
28
-
29
-
30
-
31
-
32
-
33
-
34
-
35
-
36
-
37
-
 38
38 -
 39
39 -
 40
40 -
 41
41 -
 42
42 -
 43
43 -
 44
44 -
 45
45 -
 46
46 -
 47
47 -
 48
48 -
 49
49 -
 50
50 -
 51
51 -
 52
52 -
 53
53 -
 54
54 -
 55
55 -
 56
56 -
 57
57 -
 58
58 -
59
-
60
-
61
-
62
-
63
-
64
-
65
-
66
-
67
-
68
-
69
-
70
-
71
-
72
-
73
-
74
-
75
-
76
-
77
-
78
-
79
-
80
-
81
-
82
-
83
-
84
-
85
-
86
-
87
-
88
-
89
-
90
-
91
-
92
-
93
-
94
-
95
-
96
-
97
-
98
-
99
-
100
-
101
-
102
-
103
-
104
-
105
-
106
-
107
-
108
-
109
-
110
-
111
-
112
-
113
-
114
-
115
-
116
-
117
-
118
-
119
-
120
-
121
-
122
-
123
-
124
-
125
-
126
-
127
-
128
-
129
-
130
-
131
-
132
-
133
-
134
-
135
-
136
-
137
-
138
-
139
-
140
-
141
-
142
-
143
-
144
-
145
-
146
-
147
-
148
-
149
-
150
-
151
-
152
-
153
-
154
-
155
-
156
-
157
-
158
-
159
-
160
-
161
-
162
-
163
-
164
-
165
-
166
-
167
-
168
-
169
-
170
-
171
-
172
-
173
-
174
-
175
-
176
-
177
-
178
-
179
-
180
-
181
-
182
-
183
-
184
-
185
-
186
-
187
-
188
-
189
-
190
-
191
-
192
-
193
-
194
-
195
-
196
-
197
-
198
-
199
-
200
-
201
-
202
-
203
-
204
-
205
-
206
-
207
-
208
-
209
-
210
-
211
-
212
-
213
-
214
-
215
-
216
-
217
 |
 |

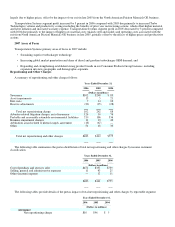
LIQUIDITY AND CAPITAL RESOURCES
The Company continues to manage its businesses to maximize operating cash flows as the primary source of liquidity. We
supplement operating cash with short-term debt from the commercial paper market and with long-term borrowings. We continue to
balance our cash and financing uses through investment in our existing core businesses, acquisition activity, share repurchases and
dividends.
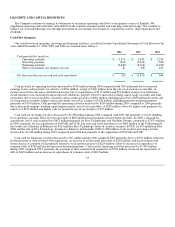
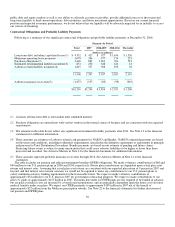
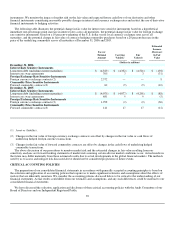
Cash Flow Summary
Our cash flows from operating, investing and financing activities, as reflected in the Consolidated Statement of Cash Flows for the
years ended December 31. 2006, 2005 and 2004 are summarized as follows:
2006 2005 2004
Cash provided by (used for):
Operating activities $ 3,211 $ 2,442 $ 2,253
Investing activities (614) (2,010) (584)
Financing activities (2,649) (2,716) (1,223)
Effect of exchange rate changes on cash 42 (68) 190
Net (decrease)/increase in cash and cash equivalents $ (10) $ (2,352) $ 636
Cash provided by operating activities increased by $769 million during 2006 compared with 2005 primarily due to increased
earnings, lower cash payments for asbestos of $331 million, receipt of $100 million from the sale of an insurance receivable, an
increase in customer advances and deferred income (net of acquisitions) of $115 million and $93 million receipt of an arbitration
award relating to raw material pricing in Specialty Materials, partially offset by increased working capital usage (accounts and other
receivables (net of tax receivables), inventory and accounts payable) of $263 million (including proceeds of $58 million from the sale
of a long-term receivable), higher cash tax payments (net of tax receipts) of $236 million and higher pension and postretirement
payments of $154 million. Cash provided by operating activities increased by $189 million during 2005 compared to 2004 primarily
due to increased earnings, working capital improvements, net of tax receivables, of $258 million, offset by higher cash payments for
asbestos of $232 million and higher cash tax payments (net of tax receipts) of $57 million.
Cash used for investing activities decreased by $1,396 million during 2006 compared with 2005 due primarily to lower spending
for acquisitions, partially offset by lower proceeds of $285 million from maturities of investment securities. In 2006, cash paid for
acquisitions, net of cash acquired was $633 million primarily for First Technologies and Gardiner Groupe, compared to $2,679 million
in 2005, primarily for our acquisitions of NOVAR and UOP. Sale proceeds from divestitures was $665 million in the 2006 primarily
due to the sale of Indalex in February for $425 million, First Technology Safety & Analysis business (FTSA) for $93 million in May
2006 and the sale of First Technology Automotive Business in December 2006 for $90 million. Cash used for investing activities
increased by $1,426 million during 2005 compared with 2004 due primarily to the acquisition of NOVAR and UOP.
Cash used for financing activities decreased by $67 million during 2006 compared 2005 primarily due to a $356 million reduction
for the payment of debt assumed with acquisitions, an increase in net proceeds from debt of $258 million, and increased proceeds
from issuance of common stock primarily related to stock option exercises of $229 million, offset by increases in repurchases of
common stock of $763 million and increased dividend payments. Cash used for financing activities increased by $1,493 million
during 2005 compared 2004, primarily due payment of debt assumed with acquisition of $702 million, increased net repayments of
debt of $418 million and an increase in repurchases of common stock of $409 million.
33