Honeywell 2006 Annual Report Download - page 89
Download and view the complete annual report
Please find page 89 of the 2006 Honeywell annual report below. You can navigate through the pages in the report by either clicking on the pages listed below, or by using the keyword search tool below to find specific information within the annual report.-
 1
1 -
2
-
3
-
4
-
5
-
6
-
7
-
8
-
9
-
10
-
11
-
12
-
13
-
14
-
15
-
16
-
17
-
18
-
19
-
20
-
21
-
22
-
23
-
24
-
25
-
26
-
27
-
28
-
29
-
30
-
31
-
32
-
33
-
34
-
35
-
36
-
37
-
38
-
39
-
40
-
41
-
42
-
43
-
44
-
45
-
46
-
47
-
48
-
49
-
50
-
51
-
52
-
53
-
54
-
55
-
56
-
57
-
58
-
59
-
60
-
61
-
62
-
63
-
64
-
65
-
66
-
67
-
68
-
69
-
70
-
71
-
72
-
73
-
74
-
75
-
76
-
77
-
78
-
 79
79 -
 80
80 -
 81
81 -
 82
82 -
 83
83 -
 84
84 -
 85
85 -
 86
86 -
 87
87 -
 88
88 -
 89
89 -
 90
90 -
 91
91 -
 92
92 -
 93
93 -
 94
94 -
 95
95 -
 96
96 -
 97
97 -
 98
98 -
 99
99 -
100
-
101
-
102
-
103
-
104
-
105
-
106
-
107
-
108
-
109
-
110
-
111
-
112
-
113
-
114
-
115
-
116
-
117
-
118
-
119
-
120
-
121
-
122
-
123
-
124
-
125
-
126
-
127
-
128
-
129
-
130
-
131
-
132
-
133
-
134
-
135
-
136
-
137
-
138
-
139
-
140
-
141
-
142
-
143
-
144
-
145
-
146
-
147
-
148
-
149
-
150
-
151
-
152
-
153
-
154
-
155
-
156
-
157
-
158
-
159
-
160
-
161
-
162
-
163
-
164
-
165
-
166
-
167
-
168
-
169
-
170
-
171
-
172
-
173
-
174
-
175
-
176
-
177
-
178
-
179
-
180
-
181
-
182
-
183
-
184
-
185
-
186
-
187
-
188
-
189
-
190
-
191
-
192
-
193
-
194
-
195
-
196
-
197
-
198
-
199
-
200
-
201
-
202
-
203
-
204
-
205
-
206
-
207
-
208
-
209
-
210
-
211
-
212
-
213
-
214
-
215
-
216
-
217
 |
 |
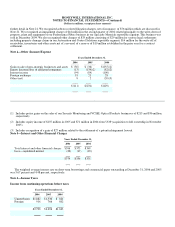
HONEYWELL INTERNATIONAL INC.
NOTES TO FINANCIAL STATEMENTS—(Continued)
(Dollars in millions, except per share amounts)
December 31,
2004
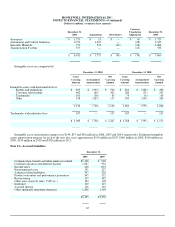
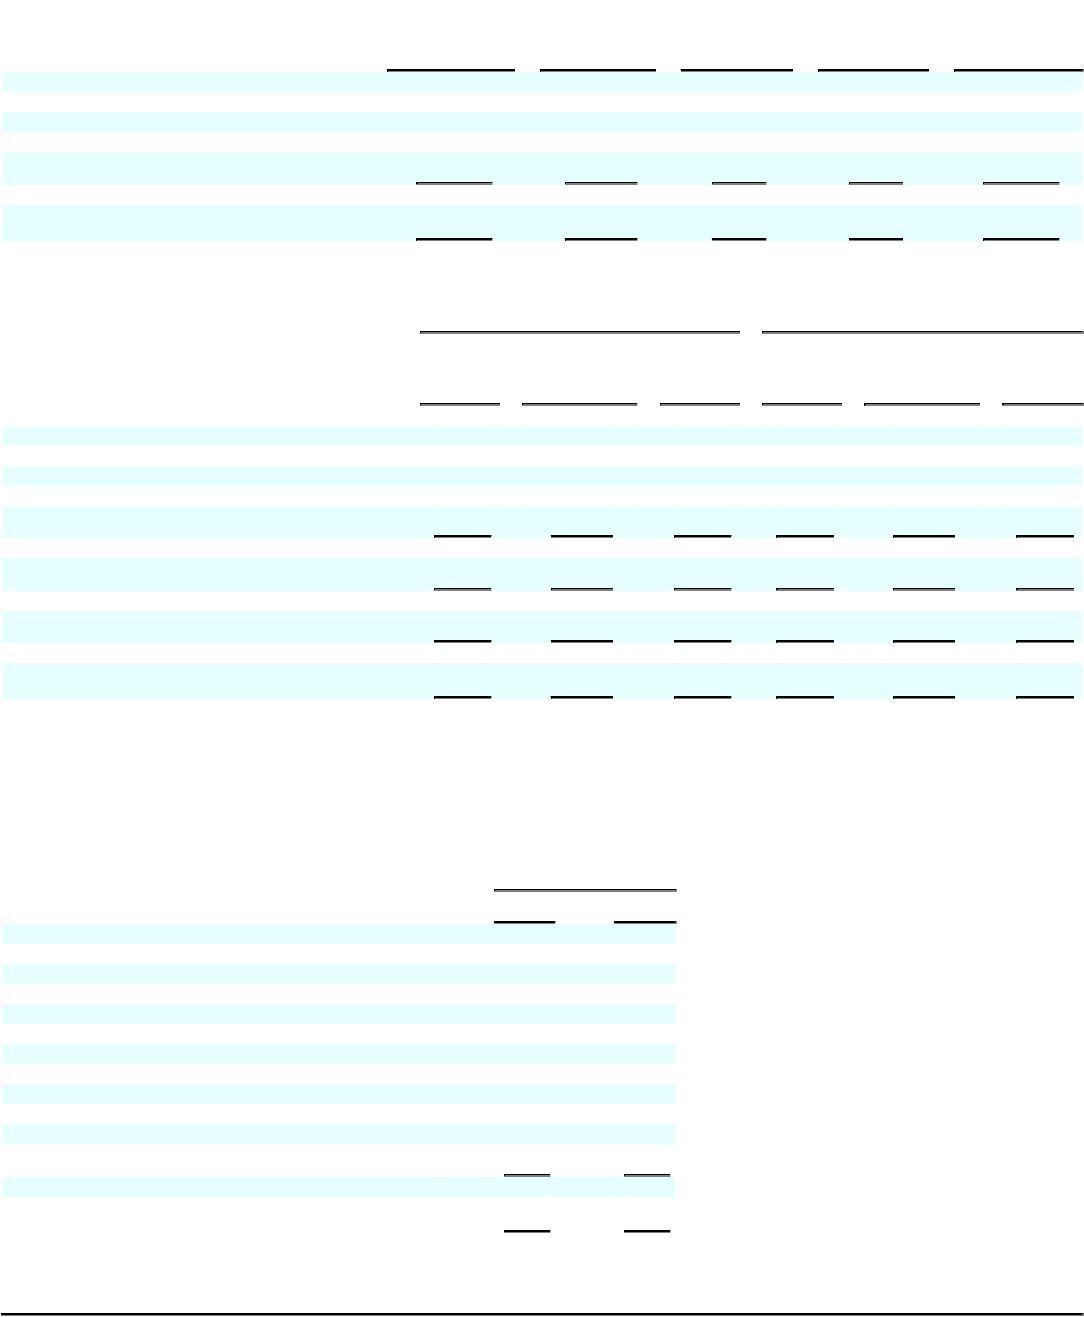
Acquisitions
Divestitures
Currency
Translation
Adjustment
December 31,
2005
Aerospace $ 1,721 $ 11 $ — $ (9) $ 1,723
Automation and Control Solutions 2,954 1,407 — (28) 4,333
Specialty Materials 779 353 (48) (18) 1,066
Transportation Systems 559 — — (21) 538
$ 6,013 $ 1,771 $ (48) $ (76) $ 7,660
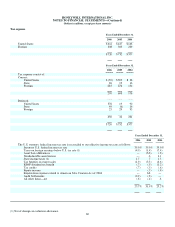
Intangible assets are comprised of:
December 31, 2006 December 31, 2005
Gross
Carrying
Amount
Accumulated
Amortization
Net
Carrying
Amount
Gross
Carrying
Amount
Accumulated
Amortization
Net
Carrying
Amount
Intangible assets with determinable lives:
Patents and technology $ 895 $ (395) $ 500 $ 821 $ (329) $ 492
Customer relationships 462 (60) 402 260 (15) 245
Trademarks 101 (16) 85 75 (6) 69
Other 418 (265) 153 505 (245) 260
1,876 (736) 1,140 1,661 (595) 1,066
Trademarks with indefinite lives 107 — 107 107 — 107
$ 1,983 $ (736) $ 1,247 $ 1,768 $ (595) $ 1,173
Intangible assets amortization expense was $144, $75 and $42 million in 2006, 2005 and 2004, respectively. Estimated intangible
assets amortization expense for each of the next five years approximates $150 million in 2007, $140 million in 2008, $140 million in
2009, $130 million in 2010 and $120 million in 2011.
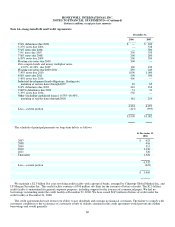
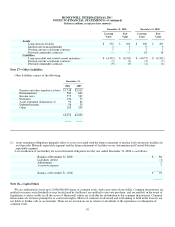
Note 13—Accrued Liabilities
December 31,
2006 2005
Compensation, benefit and other employee related $1,138 $ 996
Customer advances and deferred income 1,067 932
Income taxes 418 633
Environmental costs 251 237
Asbestos related liabilities 557 520
Product warranties and performance guarantees 347 322
Restructuring 127 182
Other taxes (payroll, sales, VAT etc.) 124 102
Insurance 110 127
Accrued interest 116 110
Other (primarily operating expenses) 1,200 1,198
$5,455 $5,359
65