Honeywell 2006 Annual Report Download - page 32
Download and view the complete annual report
Please find page 32 of the 2006 Honeywell annual report below. You can navigate through the pages in the report by either clicking on the pages listed below, or by using the keyword search tool below to find specific information within the annual report.-
 1
1 -
2
-
3
-
4
-
5
-
6
-
7
-
8
-
9
-
10
-
11
-
12
-
13
-
14
-
15
-
16
-
17
-
18
-
19
-
20
-
21
-
 22
22 -
 23
23 -
 24
24 -
 25
25 -
 26
26 -
 27
27 -
 28
28 -
 29
29 -
 30
30 -
 31
31 -
 32
32 -
 33
33 -
 34
34 -
 35
35 -
 36
36 -
 37
37 -
 38
38 -
 39
39 -
 40
40 -
 41
41 -
 42
42 -
43
-
44
-
45
-
46
-
47
-
48
-
49
-
50
-
51
-
52
-
53
-
54
-
55
-
56
-
57
-
58
-
59
-
60
-
61
-
62
-
63
-
64
-
65
-
66
-
67
-
68
-
69
-
70
-
71
-
72
-
73
-
74
-
75
-
76
-
77
-
78
-
79
-
80
-
81
-
82
-
83
-
84
-
85
-
86
-
87
-
88
-
89
-
90
-
91
-
92
-
93
-
94
-
95
-
96
-
97
-
98
-
99
-
100
-
101
-
102
-
103
-
104
-
105
-
106
-
107
-
108
-
109
-
110
-
111
-
112
-
113
-
114
-
115
-
116
-
117
-
118
-
119
-
120
-
121
-
122
-
123
-
124
-
125
-
126
-
127
-
128
-
129
-
130
-
131
-
132
-
133
-
134
-
135
-
136
-
137
-
138
-
139
-
140
-
141
-
142
-
143
-
144
-
145
-
146
-
147
-
148
-
149
-
150
-
151
-
152
-
153
-
154
-
155
-
156
-
157
-
158
-
159
-
160
-
161
-
162
-
163
-
164
-
165
-
166
-
167
-
168
-
169
-
170
-
171
-
172
-
173
-
174
-
175
-
176
-
177
-
178
-
179
-
180
-
181
-
182
-
183
-
184
-
185
-
186
-
187
-
188
-
189
-
190
-
191
-
192
-
193
-
194
-
195
-
196
-
197
-
198
-
199
-
200
-
201
-
202
-
203
-
204
-
205
-
206
-
207
-
208
-
209
-
210
-
211
-
212
-
213
-
214
-
215
-
216
-
217
 |
 |

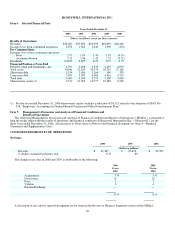
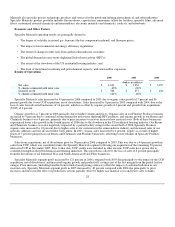
Cost of Products and Services Sold
2006 2005 2004
(Dollars in millions)
Cost of products and services sold $ 24,096 $ 21,524 $ 20,752
Gross margin % 23.2% 22.2% 18.9%
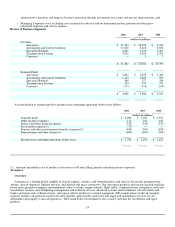
Gross margin increased by 1 percentage point in 2006 compared with 2005 due primarily to higher margins in our Specialty
Materials segment following our acquisition of full ownership of UOP (1.3 percentage points), and lower pension and other
postretirement benefits expense of 0.5 percentage points, partially offset by higher repositioning costs of 0.2 percentage points. Gross
margin increased by 3.3 percentage points in 2005 compared with 2004 primarily due to an increase of 1.2 percentage points in gross
margin for our reportable segments, lower repositioning and other charges of 0.8 percentage points and lower pension and other
postretirement benefits expense of 0.5 percentage points. For further discussion of segment results, see “Review of Business
Segments”.
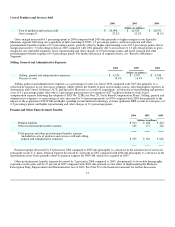
Selling, General and Administrative Expenses
2006 2005 2004
(Dollars in millions)
Selling, general and administrative expenses $ 4,210 $ 3,707 $ 3,316
Percent of sales 13.4% 13.4% 13.0%
Selling, general and administrative expenses as a percentage of sales was flat in 2006 compared with 2005 due primarily to a
reduction in expenses in our Aerospace segment, which reflects the benefit of prior restructuring actions, offsetting higher expenses in
Automation and Control Solutions (ACS) and Specialty Materials as a result of acquisitions. A reduction of repositioning and pension
costs of 0.2 percentage points offset the 0.2 percentage point increase for expenses of $77 million relating to stock-based
compensation expense following the adoption of FAS No. 123R (see Note 20, Stock-Based Compensation Plans). Selling, general and
administrative expenses as a percentage of sales increased by 0.4 percentage points in 2005 compared with 2004 due primarily to the
impact of the acquisition of NOVAR and higher spending for information technology systems (primarily ERP system in Aerospace) of
0.3 percentage points and higher repositioning and other charges of 0.1 percentage points.
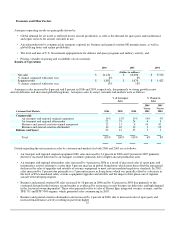
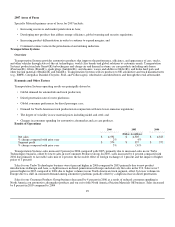
Pension and Other Postretirement Benefits
2006 2005 2004
(Dollars in millions)
Pension expense $ 313 $ 404 $ 412
Other postretirement benefits expense 146 157 216
Total pension and other postretirement benefits expense
(included in costs of products and services sold and selling,
general and administrative expenses) $ 459
$ 561
$ 628
Pension expense decreased by 23 percent in 2006 compared to 2005 due principally to a decrease in the amortization of net losses,
principally in our U.S. plans. Pension expense decreased by 2 percent in 2005 compared with 2004 due principally to a decrease in the
amortization of net losses partially offset by pension expense for NOVAR, which was acquired in 2005.
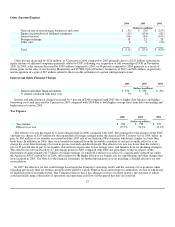
Other postretirement benefits expense decreased by 7 percent in 2006 compared to 2005, due primarily to favorable demographic
experience in the plan, and by 27 percent in 2005 compared with 2004, due primarily to the effect of implementing the Medicare
Prescription Drug, Improvement and Modernization Act of 2003. See Note 22 to the financial statements for further discussion.
21