Honeywell 2006 Annual Report Download - page 118
Download and view the complete annual report
Please find page 118 of the 2006 Honeywell annual report below. You can navigate through the pages in the report by either clicking on the pages listed below, or by using the keyword search tool below to find specific information within the annual report.-
 1
1 -
2
-
3
-
4
-
5
-
6
-
7
-
8
-
9
-
10
-
11
-
12
-
13
-
14
-
15
-
16
-
17
-
18
-
19
-
20
-
21
-
22
-
23
-
24
-
25
-
26
-
27
-
28
-
29
-
30
-
31
-
32
-
33
-
34
-
35
-
36
-
37
-
38
-
39
-
40
-
41
-
42
-
43
-
44
-
45
-
46
-
47
-
48
-
49
-
50
-
51
-
52
-
53
-
54
-
55
-
56
-
57
-
58
-
59
-
60
-
61
-
62
-
63
-
64
-
65
-
66
-
67
-
68
-
69
-
70
-
71
-
72
-
73
-
74
-
75
-
76
-
77
-
78
-
79
-
80
-
81
-
82
-
83
-
84
-
85
-
86
-
87
-
88
-
89
-
90
-
91
-
92
-
93
-
94
-
95
-
96
-
97
-
98
-
99
-
100
-
101
-
102
-
103
-
104
-
105
-
106
-
107
-
 108
108 -
 109
109 -
 110
110 -
 111
111 -
 112
112 -
 113
113 -
 114
114 -
 115
115 -
 116
116 -
 117
117 -
 118
118 -
 119
119 -
 120
120 -
 121
121 -
 122
122 -
 123
123 -
 124
124 -
 125
125 -
 126
126 -
 127
127 -
 128
128 -
129
-
130
-
131
-
132
-
133
-
134
-
135
-
136
-
137
-
138
-
139
-
140
-
141
-
142
-
143
-
144
-
145
-
146
-
147
-
148
-
149
-
150
-
151
-
152
-
153
-
154
-
155
-
156
-
157
-
158
-
159
-
160
-
161
-
162
-
163
-
164
-
165
-
166
-
167
-
168
-
169
-
170
-
171
-
172
-
173
-
174
-
175
-
176
-
177
-
178
-
179
-
180
-
181
-
182
-
183
-
184
-
185
-
186
-
187
-
188
-
189
-
190
-
191
-
192
-
193
-
194
-
195
-
196
-
197
-
198
-
199
-
200
-
201
-
202
-
203
-
204
-
205
-
206
-
207
-
208
-
209
-
210
-
211
-
212
-
213
-
214
-
215
-
216
-
217
 |
 |

HONEYWELL INTERNATIONAL INC.
NOTES TO FINANCIAL STATEMENTS—(Continued)
(Dollars in millions, except per share amounts)
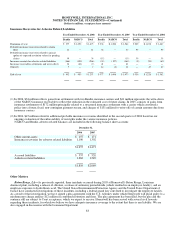
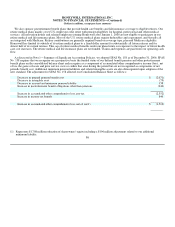
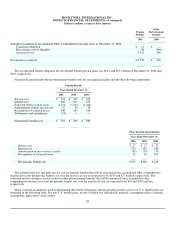
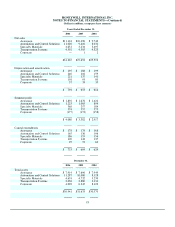
The following tables summarize the balance sheet impact, including the benefit obligations, assets and funded status associated
with our significant pension and other postretirement benefit plans at December 31, 2006 and 2005.
Pension Benefits
Other
Postretirement
Benefits
2006 2005 2006 2005
Change in benefit obligation:
Benefit obligation at beginning of year $ 16,168 $ 13,587 $ 2,318 $ 2,353
Service cost 274 236 17 17
Interest cost 908 815 122 120
Plan amendments 7 (2) (11) (20)
Actuarial (gains) losses (183) 685 (14) (74)
Acquisitions 75 1,940 — 121
Benefits paid (1,070) (965) (186) (199)
Settlements and curtailments (15) (1) — —
Other 844 (127) 19 —
Benefit obligation at end of year 17,008 16,168 2,265 2,318
Change in plan assets:
Fair value of plan assets at beginning of year 14,653 13,070 — —
Actual return on plan assets 1,897 1,229 — —
Company contributions 347 105 — —
Acquisitions 65 1,317 — —
Benefits paid (1,070) (965) — —
Other 686 (103) — —
Fair value of plan assets at end of year 16,578 14,653 — —
Funded status of plans $ (430) (1,515) $ (2,265) (2,318)
Net obligation at transition(1) — 9 — —
Net loss(1) — 3,444 — 552
Prior service cost (credit)(1) — 119 — (175)
Net amount recognized(1) — $ 2,057 — $ (1,941)
Amounts recognized in Consolidated Balance Sheet consist of:
Prepaid pension benefit cost $ 685 $ 2,716 $ — $ —
Intangible asset(2) — 79 — —
Accrued liabilities — — (197) (197)
Postretirement benefit obligations other than pensions(3) — — (2,068) (1,744)
Accrued pension liability(4) (1,115) (767) — —
Additional minimum liability(4) — (518) — —
Accumulated other comprehensive income (loss) — 547 — —
Net amount recognized $ (430) $ 2,057 $ (2,265) $ (1,941)
(1) Disclosure is not applicable in 2006 as a result of SFAS No. 158.