Honeywell 2006 Annual Report Download - page 76
Download and view the complete annual report
Please find page 76 of the 2006 Honeywell annual report below. You can navigate through the pages in the report by either clicking on the pages listed below, or by using the keyword search tool below to find specific information within the annual report.-
 1
1 -
2
-
3
-
4
-
5
-
6
-
7
-
8
-
9
-
10
-
11
-
12
-
13
-
14
-
15
-
16
-
17
-
18
-
19
-
20
-
21
-
22
-
23
-
24
-
25
-
26
-
27
-
28
-
29
-
30
-
31
-
32
-
33
-
34
-
35
-
36
-
37
-
38
-
39
-
40
-
41
-
42
-
43
-
44
-
45
-
46
-
47
-
48
-
49
-
50
-
51
-
52
-
53
-
54
-
55
-
56
-
57
-
58
-
59
-
60
-
61
-
62
-
63
-
64
-
65
-
 66
66 -
 67
67 -
 68
68 -
 69
69 -
 70
70 -
 71
71 -
 72
72 -
 73
73 -
 74
74 -
 75
75 -
 76
76 -
 77
77 -
 78
78 -
 79
79 -
 80
80 -
 81
81 -
 82
82 -
 83
83 -
 84
84 -
 85
85 -
 86
86 -
87
-
88
-
89
-
90
-
91
-
92
-
93
-
94
-
95
-
96
-
97
-
98
-
99
-
100
-
101
-
102
-
103
-
104
-
105
-
106
-
107
-
108
-
109
-
110
-
111
-
112
-
113
-
114
-
115
-
116
-
117
-
118
-
119
-
120
-
121
-
122
-
123
-
124
-
125
-
126
-
127
-
128
-
129
-
130
-
131
-
132
-
133
-
134
-
135
-
136
-
137
-
138
-
139
-
140
-
141
-
142
-
143
-
144
-
145
-
146
-
147
-
148
-
149
-
150
-
151
-
152
-
153
-
154
-
155
-
156
-
157
-
158
-
159
-
160
-
161
-
162
-
163
-
164
-
165
-
166
-
167
-
168
-
169
-
170
-
171
-
172
-
173
-
174
-
175
-
176
-
177
-
178
-
179
-
180
-
181
-
182
-
183
-
184
-
185
-
186
-
187
-
188
-
189
-
190
-
191
-
192
-
193
-
194
-
195
-
196
-
197
-
198
-
199
-
200
-
201
-
202
-
203
-
204
-
205
-
206
-
207
-
208
-
209
-
210
-
211
-
212
-
213
-
214
-
215
-
216
-
217
 |
 |

HONEYWELL INTERNATIONAL INC.
NOTES TO FINANCIAL STATEMENTS—(Continued)
(Dollars in millions, except per share amounts)
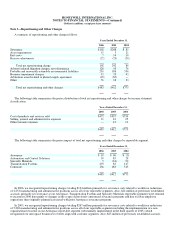
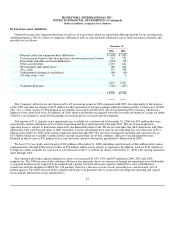
Note 3—Repositioning and Other Charges
A summary of repositioning and other charges follows:
Years Ended December 31,
2006 2005 2004
Severance $102 $248 $ 85
Asset impairments 15 5 21
Exit costs 7 14 10
Reserve adjustments (22) (25) (28)
Total net repositioning charge 102 242 88
Asbestos related litigation charges, net of insurance 126 10 76
Probable and reasonably estimable environmental liabilities 210 186 536
Business impairment charges 12 23 42
Arbitration award related to phenol supply agreement (18) (67) —
Other 51 18 33
Total net repositioning and other charges $483 $412 $775
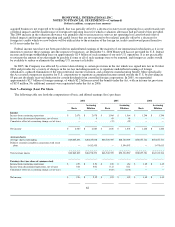
The following table summarizes the pretax distribution of total net repositioning and other charges by income statement
classification.
Years Ended December 31,
2006 2005 2004
Cost of products and services sold $472 $357 $739
Selling, general and administrative expenses 11 43 25
Other (income) expense — 12 11
$483 $412 $775
The following table summarizes the pretax impact of total net repositioning and other charges by reportable segment.
Years Ended December 31,
2006 2005 2004
Aerospace $ 10 $ 96 $ (5)
Automation and Control Solutions 39 85 28
Specialty Materials 5 (34) 90
Transportation Systems 293 82 147
Corporate 136 183 515
$483 $412 $775
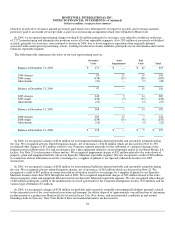
In 2006, we recognized repositioning charges totaling $124 million primarily for severance costs related to workforce reductions
of 2,253 manufacturing and administrative positions across all of our reportable segments. Also, $22 million of previously established
accruals, primarily for severance at our Aerospace, Transportation Systems and Specialty Materials reportable segments were returned
to income in 2006 due mainly to changes in the scope of previously announced severance programs and due to fewer employee
separations than originally planned associated with prior Aerospace severance programs.
In 2005, we recognized repositioning charges totaling $267 million primarily for severance costs related to workforce reductions
of 5,269 manufacturing and administrative positions across all of our reportable segments including the implementation of a new
organizational structure in our Aerospace reportable segment (substantially implemented in the third quarter of 2005) which
reorganized our Aerospace businesses to better align with customer segments. Also, $25 million of previously established accruals,