Honeywell 2006 Annual Report Download - page 33
Download and view the complete annual report
Please find page 33 of the 2006 Honeywell annual report below. You can navigate through the pages in the report by either clicking on the pages listed below, or by using the keyword search tool below to find specific information within the annual report.-
 1
1 -
2
-
3
-
4
-
5
-
6
-
7
-
8
-
9
-
10
-
11
-
12
-
13
-
14
-
15
-
16
-
17
-
18
-
19
-
20
-
21
-
22
-
 23
23 -
 24
24 -
 25
25 -
 26
26 -
 27
27 -
 28
28 -
 29
29 -
 30
30 -
 31
31 -
 32
32 -
 33
33 -
 34
34 -
 35
35 -
 36
36 -
 37
37 -
 38
38 -
 39
39 -
 40
40 -
 41
41 -
 42
42 -
 43
43 -
44
-
45
-
46
-
47
-
48
-
49
-
50
-
51
-
52
-
53
-
54
-
55
-
56
-
57
-
58
-
59
-
60
-
61
-
62
-
63
-
64
-
65
-
66
-
67
-
68
-
69
-
70
-
71
-
72
-
73
-
74
-
75
-
76
-
77
-
78
-
79
-
80
-
81
-
82
-
83
-
84
-
85
-
86
-
87
-
88
-
89
-
90
-
91
-
92
-
93
-
94
-
95
-
96
-
97
-
98
-
99
-
100
-
101
-
102
-
103
-
104
-
105
-
106
-
107
-
108
-
109
-
110
-
111
-
112
-
113
-
114
-
115
-
116
-
117
-
118
-
119
-
120
-
121
-
122
-
123
-
124
-
125
-
126
-
127
-
128
-
129
-
130
-
131
-
132
-
133
-
134
-
135
-
136
-
137
-
138
-
139
-
140
-
141
-
142
-
143
-
144
-
145
-
146
-
147
-
148
-
149
-
150
-
151
-
152
-
153
-
154
-
155
-
156
-
157
-
158
-
159
-
160
-
161
-
162
-
163
-
164
-
165
-
166
-
167
-
168
-
169
-
170
-
171
-
172
-
173
-
174
-
175
-
176
-
177
-
178
-
179
-
180
-
181
-
182
-
183
-
184
-
185
-
186
-
187
-
188
-
189
-
190
-
191
-
192
-
193
-
194
-
195
-
196
-
197
-
198
-
199
-
200
-
201
-
202
-
203
-
204
-
205
-
206
-
207
-
208
-
209
-
210
-
211
-
212
-
213
-
214
-
215
-
216
-
217
 |
 |

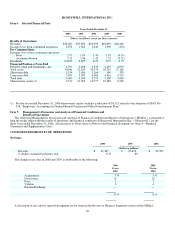
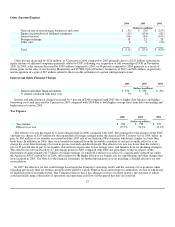
Other (Income)/Expense
2006 2005 2004
(Dollars in millions)
Gain on sale of non-strategic businesses and assets $ (30) $ (36) $ (255)
Equity (income)/loss of affiliated companies (13) (134) (82)
Interest income (94) (84) (100)
Foreign exchange 18 21 28
Other (net) 8 2 (20)
Total $ (111) $ (231) $ (429)
Other income decreased by $120 million, or 52 percent in 2006 compared to 2005 primarily due to a $121 million reduction in
equity income of affiliated companies primarily related to UOP, following our acquisition of full ownership of UOP in November
2005. In 2005, other income decreased by $198 million compared to 2004, or 46 percent compared to 2004 primarily as a result of
pretax gains on the sales of our Security Monitoring and VCSEL Optical Products businesses of $215 and $36 million, respectively,
and recognition of a gain of $27 million related to the favorable settlement of a patent infringement lawsuit.
Interest and Other Financial Charges
2006 2005 2004
(Dollars in millions)
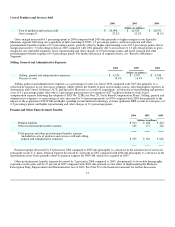
Interest and other financial charges $ 374 $ 356 $ 331
% change compared with prior year 5% 8%
Interest and other financial charges increased by 5 percent in 2006 compared with 2005 due to higher debt balances and higher
borrowing costs, and increased by 8 percent in 2005 compared with 2004 due to both higher average short-term debt outstanding and
higher interest rates in 2005.
Tax Expense
2006 2005 2004
(Dollars in millions)
Tax expense $ 720 $ 732 $ 377
Effective tax rate 25.7% 31.9% 23.2%
The effective tax rate decreased by 6.2 percentage points in 2006 compared with 2005, due principally to the absence of the 2005
one-time tax charge of $155 million for the repatriation of foreign earnings under the American Jobs Creation Act of 2004, offset, in
part, by $64 million of tax benefits associated with the 2005 sale of our Industrial Wax business which had a higher tax basis than
book basis. In addition, in 2006, there were benefits recognized from the favorable resolution of certain tax audits offset by a tax
charge for an up-front licensing of certain in-process research and development. The effective tax rate was lower than the statutory
rate of 35 percent due in part to tax benefits derived from export sales, lower foreign taxes, and benefits from tax planning strategies.
The effective tax rate increased by 8.7 percentage points in 2005 compared with 2004 due principally to the tax impact of the
repatriation of approximately $2.7 billion of foreign earnings, of which $2.2 billion was subject to a significantly reduced tax under
the American Jobs Creation Act of 2004, offset in part by the higher effective tax benefit rate for repositioning and other charges that
were incurred in 2004. See Note 6 to the financial statements for further information on taxes including a detailed effective tax rate
reconciliation.
In 2007, the effective tax rate could change based upon the Company's operating results and the outcome of tax positions taken
regarding previously filed tax returns currently under audit by various Federal, State and foreign tax authorities, several of which may
be finalized in the foreseeable future. The Company believes that it has adequate reserves for these matters, the outcome of which
could materially impact the results of operations and operating cash flows in the period that they are resolved.
22