Honeywell 2006 Annual Report Download - page 88
Download and view the complete annual report
Please find page 88 of the 2006 Honeywell annual report below. You can navigate through the pages in the report by either clicking on the pages listed below, or by using the keyword search tool below to find specific information within the annual report.-
 1
1 -
2
-
3
-
4
-
5
-
6
-
7
-
8
-
9
-
10
-
11
-
12
-
13
-
14
-
15
-
16
-
17
-
18
-
19
-
20
-
21
-
22
-
23
-
24
-
25
-
26
-
27
-
28
-
29
-
30
-
31
-
32
-
33
-
34
-
35
-
36
-
37
-
38
-
39
-
40
-
41
-
42
-
43
-
44
-
45
-
46
-
47
-
48
-
49
-
50
-
51
-
52
-
53
-
54
-
55
-
56
-
57
-
58
-
59
-
60
-
61
-
62
-
63
-
64
-
65
-
66
-
67
-
68
-
69
-
70
-
71
-
72
-
73
-
74
-
75
-
76
-
77
-
 78
78 -
 79
79 -
 80
80 -
 81
81 -
 82
82 -
 83
83 -
 84
84 -
 85
85 -
 86
86 -
 87
87 -
 88
88 -
 89
89 -
 90
90 -
 91
91 -
 92
92 -
 93
93 -
 94
94 -
 95
95 -
 96
96 -
 97
97 -
 98
98 -
99
-
100
-
101
-
102
-
103
-
104
-
105
-
106
-
107
-
108
-
109
-
110
-
111
-
112
-
113
-
114
-
115
-
116
-
117
-
118
-
119
-
120
-
121
-
122
-
123
-
124
-
125
-
126
-
127
-
128
-
129
-
130
-
131
-
132
-
133
-
134
-
135
-
136
-
137
-
138
-
139
-
140
-
141
-
142
-
143
-
144
-
145
-
146
-
147
-
148
-
149
-
150
-
151
-
152
-
153
-
154
-
155
-
156
-
157
-
158
-
159
-
160
-
161
-
162
-
163
-
164
-
165
-
166
-
167
-
168
-
169
-
170
-
171
-
172
-
173
-
174
-
175
-
176
-
177
-
178
-
179
-
180
-
181
-
182
-
183
-
184
-
185
-
186
-
187
-
188
-
189
-
190
-
191
-
192
-
193
-
194
-
195
-
196
-
197
-
198
-
199
-
200
-
201
-
202
-
203
-
204
-
205
-
206
-
207
-
208
-
209
-
210
-
211
-
212
-
213
-
214
-
215
-
216
-
217
 |
 |

HONEYWELL INTERNATIONAL INC.
NOTES TO FINANCIAL STATEMENTS—(Continued)
(Dollars in millions, except per share amounts)
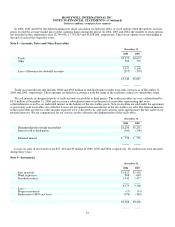
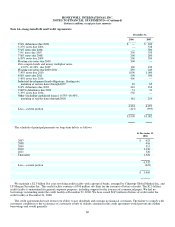
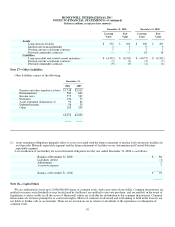
Inventories valued at LIFO amounted to $205 and $258 million at December 31, 2006 and 2005, respectively. Had such LIFO
inventories been valued at current costs, their carrying values would have been approximately $170 and $145 million higher at
December 31, 2006 and 2005, respectively.
Note 10—Investments and Long-Term Receivables
December 31,
2006 2005
Investments $ 49 $ 64
Long-term trade and other receivables 333 306
$382 $370
Long-Term Trade and Other Receivables includes $68 and $137 million of unbilled balances under long-term contracts as of
December 31, 2006 and 2005, respectively. These amounts are billed in accordance with the terms of the customer contracts to which
they relate.
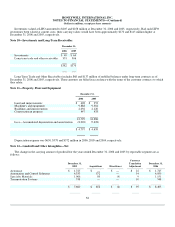
Note 11—Property, Plant and Equipment
December 31,
2006 2005
Land and improvements $ 408 $ 352
Machinery and equipment 9,888 9,381
Buildings and improvements 2,056 2,120
Construction in progress 447 433
12,799 12,286
Less—Accumulated depreciation and amortization (8,002) (7,628)
$ 4,797 $ 4,658
Depreciation expense was $650, $578 and $572 million in 2006, 2005 and 2004, respectively.
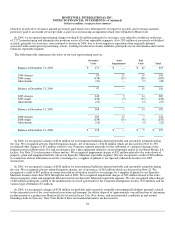
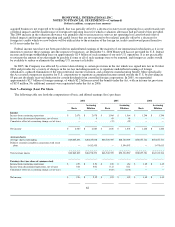
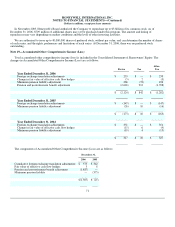
Note 12—Goodwill and Other Intangibles—Net
The change in the carrying amount of goodwill for the years ended December 31, 2006 and 2005 by reportable segment are as
follows:
December 31,
2005
Acquisitions
Divestitures
Currency
Translation
Adjustment
December 31,
2006
Aerospace $ 1,723 $ — $ — $ 22 $ 1,745
Automation and Control Solutions 4,333 572 — 54 4,959
Specialty Materials 1,066 80 (4) 9 1,151
Transportation Systems 538 — — 10 548
$ 7,660 $ 652 $ (4) $ 95 $ 8,403
64