Honeywell 2006 Annual Report Download - page 70
Download and view the complete annual report
Please find page 70 of the 2006 Honeywell annual report below. You can navigate through the pages in the report by either clicking on the pages listed below, or by using the keyword search tool below to find specific information within the annual report.-
 1
1 -
2
-
3
-
4
-
5
-
6
-
7
-
8
-
9
-
10
-
11
-
12
-
13
-
14
-
15
-
16
-
17
-
18
-
19
-
20
-
21
-
22
-
23
-
24
-
25
-
26
-
27
-
28
-
29
-
30
-
31
-
32
-
33
-
34
-
35
-
36
-
37
-
38
-
39
-
40
-
41
-
42
-
43
-
44
-
45
-
46
-
47
-
48
-
49
-
50
-
51
-
52
-
53
-
54
-
55
-
56
-
57
-
58
-
59
-
 60
60 -
 61
61 -
 62
62 -
 63
63 -
 64
64 -
 65
65 -
 66
66 -
 67
67 -
 68
68 -
 69
69 -
 70
70 -
 71
71 -
 72
72 -
 73
73 -
 74
74 -
 75
75 -
 76
76 -
 77
77 -
 78
78 -
 79
79 -
 80
80 -
81
-
82
-
83
-
84
-
85
-
86
-
87
-
88
-
89
-
90
-
91
-
92
-
93
-
94
-
95
-
96
-
97
-
98
-
99
-
100
-
101
-
102
-
103
-
104
-
105
-
106
-
107
-
108
-
109
-
110
-
111
-
112
-
113
-
114
-
115
-
116
-
117
-
118
-
119
-
120
-
121
-
122
-
123
-
124
-
125
-
126
-
127
-
128
-
129
-
130
-
131
-
132
-
133
-
134
-
135
-
136
-
137
-
138
-
139
-
140
-
141
-
142
-
143
-
144
-
145
-
146
-
147
-
148
-
149
-
150
-
151
-
152
-
153
-
154
-
155
-
156
-
157
-
158
-
159
-
160
-
161
-
162
-
163
-
164
-
165
-
166
-
167
-
168
-
169
-
170
-
171
-
172
-
173
-
174
-
175
-
176
-
177
-
178
-
179
-
180
-
181
-
182
-
183
-
184
-
185
-
186
-
187
-
188
-
189
-
190
-
191
-
192
-
193
-
194
-
195
-
196
-
197
-
198
-
199
-
200
-
201
-
202
-
203
-
204
-
205
-
206
-
207
-
208
-
209
-
210
-
211
-
212
-
213
-
214
-
215
-
216
-
217
 |
 |
HONEYWELL INTERNATIONAL INC.
NOTES TO FINANCIAL STATEMENTS—(Continued)
(Dollars in millions, except per share amounts)
order to estimate the portion of the award that will ultimately vest. The estimate is based on our historical rates of forfeiture. In our pro
forma information required under SFAS No. 123 for the years prior to 2006, we accounted for forfeitures as they occurred.
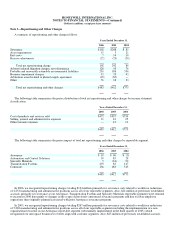
Compensation cost related to stock options recognized in operating results (included in selling, general and administrative
expenses) under SFAS No. 123R in 2006 was $77 million on a pre-tax basis and the associated future income tax benefit recognized
was $28 million. Compensation cost related to stock options recognized in our Consolidated Statement of Operations in 2006 includes
(1) compensation cost for stock option awards granted prior to, but not yet vested as of December 31, 2005, based on the grant-date
fair value estimated in accordance with the pro forma provisions of SFAS No. 123 and (2) compensation cost for stock option awards
granted subsequent to December 31, 2005, based on the grant-date fair value estimated in accordance with the provisions of SFAS
No. 123R.
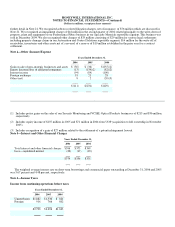
The following table illustrates the effect on net income and earnings per share as if we had applied the fair value recognition
provisions of SFAS No. 123 in the years prior to the adoption of FAS No. 123R.
2005 2004
Net income, as reported $ 1,638 $ 1,246
Deduct: Total stock-based employee compensation cost determined under fair
value method for fixed stock option plans, net of related tax effects
(53)
(42)
Pro forma net income $ 1,585 $ 1,204
Earnings per share of common stock:
Basic—as reported $ 1.93 $ 1.45
Basic—pro forma $ 1.87 $ 1.40
Earnings per share of common stock:
Assuming dilution—as reported $ 1.92 $ 1.45
Assuming dilution—pro forma $ 1.86 $ 1.40
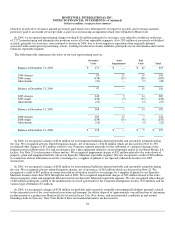
The following table sets forth fair value per share information, including related assumptions, used to determine compensation cost
consistent with the requirements of SFAS No. 123.
2005 2004
Weighted average fair value per share of options granted during the year(1) $ 10.67 $ 10.97
Assumptions:
Expected annual dividend yield 2.4% 2.1%
Expected volatility 34.8% 37.9%
Risk-free rate of return 3.7% 3.3%
Expected option term (years) 5.0 5.0
(1) Estimated on date of grant using Black-Scholes option-pricing model.
Foreign Currency Translation—Assets and liabilities of subsidiaries operating outside the United States with a functional
currency other than U.S. dollars are translated into U.S. dollars using year-end exchange rates. Sales, costs and expenses are translated
at the average exchange rates in effect during the year. Foreign currency translation gains and losses are included as a component of
Accumulated Other Nonowner Changes in Shareowners' Equity. For subsidiaries operating in highly inflationary environments,
inventories and property, plant and equipment, including related expenses, are remeasured at the exchange rate in effect on the date
the assets were acquired, while monetary
52