Honeywell 2006 Annual Report Download - page 40
Download and view the complete annual report
Please find page 40 of the 2006 Honeywell annual report below. You can navigate through the pages in the report by either clicking on the pages listed below, or by using the keyword search tool below to find specific information within the annual report.-
 1
1 -
2
-
3
-
4
-
5
-
6
-
7
-
8
-
9
-
10
-
11
-
12
-
13
-
14
-
15
-
16
-
17
-
18
-
19
-
20
-
21
-
22
-
23
-
24
-
25
-
26
-
27
-
28
-
29
-
 30
30 -
 31
31 -
 32
32 -
 33
33 -
 34
34 -
 35
35 -
 36
36 -
 37
37 -
 38
38 -
 39
39 -
 40
40 -
 41
41 -
 42
42 -
 43
43 -
 44
44 -
 45
45 -
 46
46 -
 47
47 -
 48
48 -
 49
49 -
 50
50 -
51
-
52
-
53
-
54
-
55
-
56
-
57
-
58
-
59
-
60
-
61
-
62
-
63
-
64
-
65
-
66
-
67
-
68
-
69
-
70
-
71
-
72
-
73
-
74
-
75
-
76
-
77
-
78
-
79
-
80
-
81
-
82
-
83
-
84
-
85
-
86
-
87
-
88
-
89
-
90
-
91
-
92
-
93
-
94
-
95
-
96
-
97
-
98
-
99
-
100
-
101
-
102
-
103
-
104
-
105
-
106
-
107
-
108
-
109
-
110
-
111
-
112
-
113
-
114
-
115
-
116
-
117
-
118
-
119
-
120
-
121
-
122
-
123
-
124
-
125
-
126
-
127
-
128
-
129
-
130
-
131
-
132
-
133
-
134
-
135
-
136
-
137
-
138
-
139
-
140
-
141
-
142
-
143
-
144
-
145
-
146
-
147
-
148
-
149
-
150
-
151
-
152
-
153
-
154
-
155
-
156
-
157
-
158
-
159
-
160
-
161
-
162
-
163
-
164
-
165
-
166
-
167
-
168
-
169
-
170
-
171
-
172
-
173
-
174
-
175
-
176
-
177
-
178
-
179
-
180
-
181
-
182
-
183
-
184
-
185
-
186
-
187
-
188
-
189
-
190
-
191
-
192
-
193
-
194
-
195
-
196
-
197
-
198
-
199
-
200
-
201
-
202
-
203
-
204
-
205
-
206
-
207
-
208
-
209
-
210
-
211
-
212
-
213
-
214
-
215
-
216
-
217
 |
 |

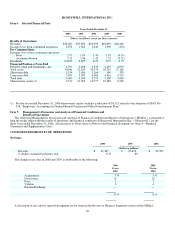
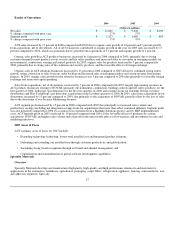
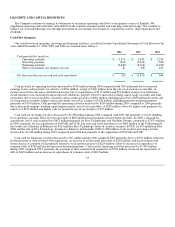
Results of Operations
2006 2005 2004
(Dollars in millions)
Net sales $ 11,020 $ 9,416 $ 8,031
% change compared with prior year 17% 17%
Segment profit $ 1,223 $ 1,065 $ 894
% change compared with prior year 15% 19%
ACS sales increased by 17 percent in 2006 compared with 2005 due to organic sales growth of 10 percent and 7 percent growth
from acquisitions, net of divestitures. All of ACS businesses contributed to organic growth in the year. In 2005 sales increased by 17
percent compared to 2004, which was primarily due to growth from acquisitions of 13 percent and organic growth of 4 percent.
Organic sales growth in ACS products businesses increased by 8 percent in 2006 compared to 2005, primarily due to strong
customer demand for new products in our security and life safety products and increased sales to customers in emerging markets for
environmental, combustion, sensing and control products. In 2005, organic sales for products increased by 5 percent compared to
2004, primarily due to strong sales of fire solutions and security products, and the favorable effects of foreign exchange.
Organic sales in ACS solutions businesses increased by 11 percent in 2006 compared to 2005 driven by continued strong orders
growth, strong conversion to sales from our order backlog and increased sales in emerging markets and strong revenue from energy
projects. In 2005, organic sales growth for the solutions businesses was 3 percent compared to 2004 due primarily to favorable foreign
exchange and increased capital spending.
Sales from acquisitions, net of divestitures, increased by 7 percent in 2006 compared with 2005, largely representing revenues in
ACS products businesses relating to NOVAR (primarily environmental, combustion, building controls and life safety products) for the
first quarter of 2006, Zellweger (gas detection) for the first two quarters of 2006 and revenues from our Gardiner Groupe (security
distribution) and First Technology (gas detection) acquisitions in the last three quarters of 2006. In 2005, sales from acquisitions net of
divestitures increased by 13 percent compared to 2004, due primarily to the acquisition of NOVAR, partially offset by the loss of sales
due to the divestiture of our Security Monitoring business.
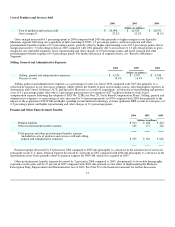
ACS segment profit increased by 15 percent in 2006 compared with 2005 due principally to increased sales volume and
productivity savings (including net integration savings from our acquisitions) that more than offset continued inflation. Segment profit
was also negatively impacted in 2006 by a contract loss experienced on a Building Solutions project, and by ERP implementation
costs. ACS segment profit in 2005 increased by 19 percent compared with 2004 as the favorable effects of productivity actions,
acquisitions (NOVAR) and higher sales volume more than offset the unfavorable effects of lower prices and investments in sales and
marketing initiatives.
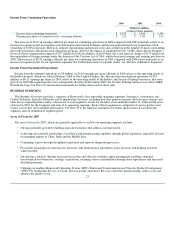
2007 Areas of Focus
ACS's primary areas of focus for 2007 include:
• Extending technology leadership: lowest total installed cost and integrated product solutions;
• Defending and extending our installed base through customer productivity and globalization;
• Sustaining strong brand recognition through our brand and channel management; and
• Centralization and standardization of global software development capabilities.
Specialty Materials
Overview
Specialty Materials develops and manufactures high-purity, high-quality and high-performance chemicals and materials for
applications in the automotive, healthcare, agricultural, packaging, carpet fibers, refrigeration, appliance, housing, semiconductor, wax
and adhesives segments. Specialty
27