Honeywell 2006 Annual Report Download - page 130
Download and view the complete annual report
Please find page 130 of the 2006 Honeywell annual report below. You can navigate through the pages in the report by either clicking on the pages listed below, or by using the keyword search tool below to find specific information within the annual report.-
 1
1 -
2
-
3
-
4
-
5
-
6
-
7
-
8
-
9
-
10
-
11
-
12
-
13
-
14
-
15
-
16
-
17
-
18
-
19
-
20
-
21
-
22
-
23
-
24
-
25
-
26
-
27
-
28
-
29
-
30
-
31
-
32
-
33
-
34
-
35
-
36
-
37
-
38
-
39
-
40
-
41
-
42
-
43
-
44
-
45
-
46
-
47
-
48
-
49
-
50
-
51
-
52
-
53
-
54
-
55
-
56
-
57
-
58
-
59
-
60
-
61
-
62
-
63
-
64
-
65
-
66
-
67
-
68
-
69
-
70
-
71
-
72
-
73
-
74
-
75
-
76
-
77
-
78
-
79
-
80
-
81
-
82
-
83
-
84
-
85
-
86
-
87
-
88
-
89
-
90
-
91
-
92
-
93
-
94
-
95
-
96
-
97
-
98
-
99
-
100
-
101
-
102
-
103
-
104
-
105
-
106
-
107
-
108
-
109
-
110
-
111
-
112
-
113
-
114
-
115
-
116
-
117
-
118
-
119
-
 120
120 -
 121
121 -
 122
122 -
 123
123 -
 124
124 -
 125
125 -
 126
126 -
 127
127 -
 128
128 -
 129
129 -
 130
130 -
 131
131 -
 132
132 -
 133
133 -
 134
134 -
 135
135 -
 136
136 -
 137
137 -
 138
138 -
 139
139 -
 140
140 -
141
-
142
-
143
-
144
-
145
-
146
-
147
-
148
-
149
-
150
-
151
-
152
-
153
-
154
-
155
-
156
-
157
-
158
-
159
-
160
-
161
-
162
-
163
-
164
-
165
-
166
-
167
-
168
-
169
-
170
-
171
-
172
-
173
-
174
-
175
-
176
-
177
-
178
-
179
-
180
-
181
-
182
-
183
-
184
-
185
-
186
-
187
-
188
-
189
-
190
-
191
-
192
-
193
-
194
-
195
-
196
-
197
-
198
-
199
-
200
-
201
-
202
-
203
-
204
-
205
-
206
-
207
-
208
-
209
-
210
-
211
-
212
-
213
-
214
-
215
-
216
-
217
 |
 |

HONEYWELL INTERNATIONAL INC.
NOTES TO FINANCIAL STATEMENTS—(Continued)
(Dollars in millions, except per share amounts)
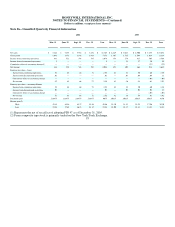
Note 26—Unaudited Quarterly Financial Information
2006 2005
Mar. 31 June 30 Sept. 30 Dec. 31 Year Mar. 31 June 30 Sept. 30 Dec. 31 Year
Net sales $ 7,241 $ 7,898 $ 7,952 $ 8,276 $ 31,367 $ 6,449 $ 7,028 $ 6,900 $ 7,275 $ 27,652
Gross profit 1,641 1,871 1,841 1,918 7,271 1,367 1,525 1,598 1,638 6,128
Income from continuing operations 431 521 541 585 2,078 358 274 427 505 1,564
Income from discontinued operations 5 — — — 5 — 28 37 30 95
Cumulative effect of accounting change(1) — — — — — — — — (21) (21)
Net income 436 521 541 585 2,083 358 302 464 514 1,638
Earnings per share—basic:
Income from continuing operations .51 .63 .66 .72 2.53 .42 .33 .50 .60 1.85
Income from discontinued operations .01 — — — .01 — .03 .04 .04 .11
Cumulative effect of accounting change — — — — — — — — (.03) (.03)
Net income .52 .63 .66 .72 2.54 .42 .36 .54 .61 1.93
Earnings per share—assuming dilution:
Income from continuing operations .51 .63 .66 .72 2.51 .42 .33 .50 .60 1.84
Income from discontinued operations .01 — — — .01 — .03 .04 .04 .11
Cumulative effect of accounting change — — — — — — — — (.03) (.03)
Net income .52 .63 .66 .72 2.52 .42 .36 .54 .61 1.92
Dividends paid .226875 .226875 .226875 .226875 .9075 .20625 .20625 .20625 .20625 .8250
Market price(2)
High 42.85 44.16 41.37 45.46 45.46 39.30 38.12 39.29 37.96 39.30
Low 35.84 37.62 36.21 41.35 35.84 34.00 35.17 35.41 33.21 33.21
(1) Represents the net of tax effect of adopting FIN 47 as of December 31, 2005.
(2) From composite tape-stock is primarily traded on the New York Stock Exchange.
95