Honeywell 2006 Annual Report Download - page 37
Download and view the complete annual report
Please find page 37 of the 2006 Honeywell annual report below. You can navigate through the pages in the report by either clicking on the pages listed below, or by using the keyword search tool below to find specific information within the annual report.-
 1
1 -
2
-
3
-
4
-
5
-
6
-
7
-
8
-
9
-
10
-
11
-
12
-
13
-
14
-
15
-
16
-
17
-
18
-
19
-
20
-
21
-
22
-
23
-
24
-
25
-
26
-
 27
27 -
 28
28 -
 29
29 -
 30
30 -
 31
31 -
 32
32 -
 33
33 -
 34
34 -
 35
35 -
 36
36 -
 37
37 -
 38
38 -
 39
39 -
 40
40 -
 41
41 -
 42
42 -
 43
43 -
 44
44 -
 45
45 -
 46
46 -
 47
47 -
48
-
49
-
50
-
51
-
52
-
53
-
54
-
55
-
56
-
57
-
58
-
59
-
60
-
61
-
62
-
63
-
64
-
65
-
66
-
67
-
68
-
69
-
70
-
71
-
72
-
73
-
74
-
75
-
76
-
77
-
78
-
79
-
80
-
81
-
82
-
83
-
84
-
85
-
86
-
87
-
88
-
89
-
90
-
91
-
92
-
93
-
94
-
95
-
96
-
97
-
98
-
99
-
100
-
101
-
102
-
103
-
104
-
105
-
106
-
107
-
108
-
109
-
110
-
111
-
112
-
113
-
114
-
115
-
116
-
117
-
118
-
119
-
120
-
121
-
122
-
123
-
124
-
125
-
126
-
127
-
128
-
129
-
130
-
131
-
132
-
133
-
134
-
135
-
136
-
137
-
138
-
139
-
140
-
141
-
142
-
143
-
144
-
145
-
146
-
147
-
148
-
149
-
150
-
151
-
152
-
153
-
154
-
155
-
156
-
157
-
158
-
159
-
160
-
161
-
162
-
163
-
164
-
165
-
166
-
167
-
168
-
169
-
170
-
171
-
172
-
173
-
174
-
175
-
176
-
177
-
178
-
179
-
180
-
181
-
182
-
183
-
184
-
185
-
186
-
187
-
188
-
189
-
190
-
191
-
192
-
193
-
194
-
195
-
196
-
197
-
198
-
199
-
200
-
201
-
202
-
203
-
204
-
205
-
206
-
207
-
208
-
209
-
210
-
211
-
212
-
213
-
214
-
215
-
216
-
217
 |
 |

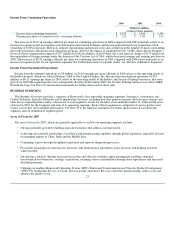
Economic and Other Factors
Aerospace operating results are principally driven by:
• Global demand for air travel as reflected in new aircraft production, as well as the demand for spare parts and maintenance
and repair services for aircraft currently in use;
• Aircraft production by commercial air transport, regional jet, business and general aviation OE manufacturers, as well as
global flying hours and airline profitability;
• The level and mix of U.S. Government appropriations for defense and space programs and military activity; and
• Pricing, volatility in pricing and availability of raw materials.
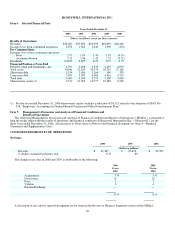
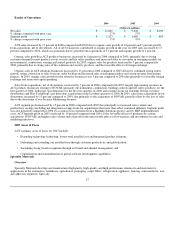
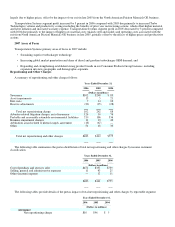
Results of Operations
2006 2005 2004
(Dollars in millions)
Net sales $ 11,124 $ 10,496 $ 9,740
% change compared with prior year 6% 8%
Segment profit $ 1,892 $ 1,676 $ 1,422
% change compared with prior year 13% 18%
Aerospace sales increased by 6 percent and 8 percent in 2006 and 2005, respectively, due primarily to strong growth in new
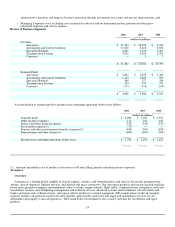
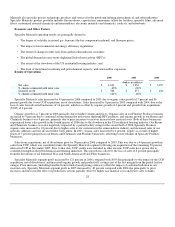
aircraft deliveries and increased global flying hours. Aerospace sales by major customer end-markets were as follows:
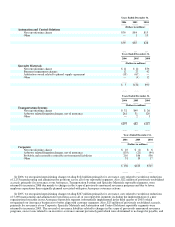
% of Aerospace
Sales % Change in
Sales
Customer End-Markets
2006
2005
2004
2006
Versus
2005
2005
Versus
2004
Commercial:
Air transport and regional original equipment 16% 15% 15% 14% 9%
Air transport and regional aftermarket 22 23 24 4 3
Business and general aviation original equipment 12 11 8 16 42
Business and general aviation aftermarket 10 10 10 1 10
Defense and Space 40 41 43 3 2
Total 100% 100% 100% 6% 8%
Details regarding the net increase in sales by customer end-markets for both 2006 and 2005 are as follows:
• Air transport and regional original equipment (OE) sales increased by 14 percent in 2006 and 9 percent in 2005 primarily
driven by increased deliveries to air transport customers primarily due to higher aircraft production rates.
• Air transport and regional aftermarket sales increased by 4 percent in 2006 as a result of increased sales of spare parts and
maintenance activity relating to a more than 5 percent increase in global flying hours which more than offset the anticipated
decline in the sales of upgrades and retrofits of avionics equipment to meet certain mandated regulatory standards. In 2005,
sales increased by 3 percent due primarily to a 7 percent increase in flying hours which was partially offset by a decrease in
the level of FAA-mandated safety avionics equipment upgrades and retrofits and the impact of the phase-out of regional
aircraft with turboprop engines.
• Business and general aviation OE sales increased by 16 percent in 2006 and by 42 percent in 2005 due primarily to the
continued demand in the business jet end market as evidenced by an increase in new business jet deliveries and high demand
in the fractional ownership market. These sales primarily relate to sales of Primus Epic integrated avionics systems, and the
TFE 731 and HTF 7000 engines, which generated sales commencing in 2005.
• Business and general aviation aftermarket sales increased by 1 percent in 2006, due to increased sales of spare parts and
increased maintenance activity resulting in part from higher
25