Honeywell 2006 Annual Report Download - page 85
Download and view the complete annual report
Please find page 85 of the 2006 Honeywell annual report below. You can navigate through the pages in the report by either clicking on the pages listed below, or by using the keyword search tool below to find specific information within the annual report.-
 1
1 -
2
-
3
-
4
-
5
-
6
-
7
-
8
-
9
-
10
-
11
-
12
-
13
-
14
-
15
-
16
-
17
-
18
-
19
-
20
-
21
-
22
-
23
-
24
-
25
-
26
-
27
-
28
-
29
-
30
-
31
-
32
-
33
-
34
-
35
-
36
-
37
-
38
-
39
-
40
-
41
-
42
-
43
-
44
-
45
-
46
-
47
-
48
-
49
-
50
-
51
-
52
-
53
-
54
-
55
-
56
-
57
-
58
-
59
-
60
-
61
-
62
-
63
-
64
-
65
-
66
-
67
-
68
-
69
-
70
-
71
-
72
-
73
-
74
-
 75
75 -
 76
76 -
 77
77 -
 78
78 -
 79
79 -
 80
80 -
 81
81 -
 82
82 -
 83
83 -
 84
84 -
 85
85 -
 86
86 -
 87
87 -
 88
88 -
 89
89 -
 90
90 -
 91
91 -
 92
92 -
 93
93 -
 94
94 -
 95
95 -
96
-
97
-
98
-
99
-
100
-
101
-
102
-
103
-
104
-
105
-
106
-
107
-
108
-
109
-
110
-
111
-
112
-
113
-
114
-
115
-
116
-
117
-
118
-
119
-
120
-
121
-
122
-
123
-
124
-
125
-
126
-
127
-
128
-
129
-
130
-
131
-
132
-
133
-
134
-
135
-
136
-
137
-
138
-
139
-
140
-
141
-
142
-
143
-
144
-
145
-
146
-
147
-
148
-
149
-
150
-
151
-
152
-
153
-
154
-
155
-
156
-
157
-
158
-
159
-
160
-
161
-
162
-
163
-
164
-
165
-
166
-
167
-
168
-
169
-
170
-
171
-
172
-
173
-
174
-
175
-
176
-
177
-
178
-
179
-
180
-
181
-
182
-
183
-
184
-
185
-
186
-
187
-
188
-
189
-
190
-
191
-
192
-
193
-
194
-
195
-
196
-
197
-
198
-
199
-
200
-
201
-
202
-
203
-
204
-
205
-
206
-
207
-
208
-
209
-
210
-
211
-
212
-
213
-
214
-
215
-
216
-
217
 |
 |

HONEYWELL INTERNATIONAL INC.
NOTES TO FINANCIAL STATEMENTS—(Continued)
(Dollars in millions, except per share amounts)
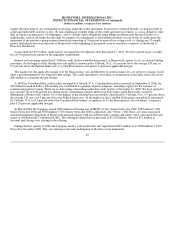
acquired businesses not expected to be realized, that was partially offset by a decrease in state tax net operating loss carryforwards (net
of federal impact) and the disallowance of foreign net operating losses for which a valuation allowance had previously been provided.
The 2004 increase in the valuation allowance was primarily due to an increase in state tax net operating loss carryforwards (net of
federal impact) and foreign net operating and capital losses that are not expected to be realized, partially offset by a decrease for
foreign tax credits which we now believe will be utilized due to the extension of the foreign tax credit carryforward period from five
to 10 years under the Act.
Federal income taxes have not been provided on undistributed earnings of the majority of our international subsidiaries as it is our
intention to reinvest these earnings into the respective businesses. At December 31, 2006 Honeywell has not provided for U.S. federal
income and foreign withholding taxes on approximately $2.9 billion of such earnings of our non-U.S. operations. It is not practicable
to estimate the amount of tax that might be payable if some or all of such earnings were to be remitted, and foreign tax credits would
be available to reduce or eliminate the resulting U.S. income tax liability.
In 2005, the Company was effected by actions taken relating to certain provisions in the Act which was signed into law in October
2004 and provides for a variety of changes in the tax law including incentives to repatriate undistributed earnings of foreign
subsidiaries, a phased elimination of the extra-territorial income exclusion, and a domestic manufacturing benefit. More specifically,
the Act created a temporary incentive for U.S. corporations to repatriate accumulated income earned outside the U.S. by providing an
85 percent dividends received deduction for certain dividends from controlled foreign corporations. In 2005, we repatriated
approximately $2.7 billion of foreign earnings, of which $2.2 billion received the benefit under the Act, with an income tax provision
of $155 million. No additional amounts were repatriated under the Act in 2006.
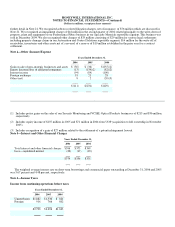
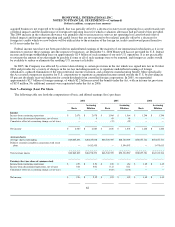
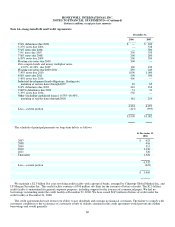
Note 7—Earnings (Loss) Per Share
The following table sets forth the computations of basic and diluted earnings (loss) per share:
2006 2005 2004
Basic Assuming
Dilution Basic Assuming
Dilution Basic Assuming
Dilution
Income
Income from continuing operations $ 2,078 $ 2,078 $ 1,564 $ 1,564 $ 1,246 $ 1,246
Income from discontinued operations, net of taxes 5 5 95 95 — —
Cumulative effect of accounting change, net of taxes — — (21) (21) — —
Net income $ 2,083 $ 2,083 $ 1,638 $ 1,638 $ 1,246 $ 1,246
Average shares
Average shares outstanding 820,845,838 820,845,838 848,740,395 848,740,395 858,857,721 858,857,721
Dilutive securities issuable in connection with stock
plans
—
5,432,435
—
3,594,592
—
3,475,613
Total average shares 820,845,838 826,278,273 848,740,395 852,334,987 858,857,721 862,333,334
Earnings (loss) per share of common stock
Income from continuing operations $ 2.53 $ 2.51 $ 1.85 $ 1.84 $ 1.45 $ 1.45
Income from discontinued operations, net of taxes 0.01 0.01 0.11 0.11 — —
Cumulative effect of accounting change, net of taxes — — (0.03) (0.03) — —
Net income $ 2.54 $ 2.52 $ 1.93 $ 1.92 $ 1.45 $ 1.45
62